
More Information
Submitted: February 25, 2026 | Approved: March 06, 2026 | Published: March 06, 2026
How to cite this article: Hussain WG, Akbar A, Shehzad S, Sharif MF. Modelling Body Shape and Size Index (BSSI) Variations: A Quantile Regression and LMS Framework for Obesity Surveillance in Pakistani Populations. J Sports Med Ther. 2026; 11(1): 1-13. Available from:
https://dx.doi.org/10.29328/journal.jsmt.1001098
DOI: 10.29328/journal.jsmt.1001098
Copyright License: © 2026 Hussain WG, et al. This is an open access article distributed under the Creative Commons Attribution License, which permits unrestricted use, distribution, and reproduction in any medium, provided the original work is properly cited.
Keywords: Obesity surveillance; Body Shape and Size Index (BSSI): Quantile regression; LMS (Lambda-Mu-Sigma); Growth charts; Pakistani population
Abbreviations: BSSI: Body Shape and Size Index; QR: Quantile Regression: LMS: Lambda-Mu-Sigma (growth modelling methodology); BMI: Body Mass Index; BSA: Body Surface Area; SD: Standard Deviation; SE: Standard Error; NQRM: Nonparametric Quantile Regression Modelling; SPLMS: Semi-Parametric Lambda-Mu-Sigma (LMS) approach; C: Caloric intake; dM/dt: Rate of change of body mass over time

Modelling Body Shape and Size Index (BSSI) Variations: A Quantile Regression and LMS Framework for Obesity Surveillance in Pakistani Populations
Waqas Ghulam Hussain1 , Atif Akbar2*, Farrukh Shehzad3 and Muhammad Fareed Sharif4
1Higher Education Department, South Punjab, Pakistan
2Department of Statistics, Bahauddin Zakariya University, Multan, Pakistan
3Department of Statistics, The Islamia University of Bahawalpur, Bahawalpur, Pakistan
4Higher Education, Department, South Punjab, Pakista
*Address for Correspondence: Dr. Atif Akbar, Associate Professor, Department of Statistics, Bahauddin Zakariya University, Multan, Pakistan, Email: [email protected]
Introduction: Obesity is a significant public health concern worldwide, characterised by excessive adiposity linked to various metabolic and cardiovascular diseases. In Pakistan, the prevalence of obesity is rising rapidly, necessitating precise tools for surveillance and early intervention. The Body Shape and Size Index (BSSI) offers a comprehensive measure of body morphology, capturing variations beyond traditional indices like BMI.
Methods: This study employed a cross-sectional, population-based design involving 9,906 participants aged 2 to 60 years from South Punjab, Pakistan. Using stratified random sampling, anthropometric measurements were collected following standardised protocols. Advanced statistical methods, including nonparametric quantile regression and semi-parametric LMS (Lambda-Mu-Sigma) modelling, were applied to develop age- and sex-specific growth charts for BSSI. Additionally, dynamic physiological models based on differential equations were formulated to examine the influence of caloric intake and physical activity on body mass trajectories.
Results: Significant gender differences were observed, with males exhibiting a higher mean BSSI than females. Nonlinear age-related trends revealed accelerated adiposity during adolescence and middle age. Socioeconomic status influenced BSSI, with lower-income groups showing higher values. Growth charts derived from both modelling techniques demonstrated high concordance, providing reliable reference standards across the age spectrum. Dynamic models indicated that increased caloric intake elevates BSSI, while physical activity mitigates adiposity gains over time.
Conclusion: The integrated application of quantile regression, LMS frameworks, and physiological modelling offers robust, population-specific growth standards for BSSI in Pakistani populations. These models facilitate early detection of abnormal body morphology, enabling targeted public health interventions to curb the rising obesity epidemic in Pakistan and comparable settings.
Obesity has emerged as a global epidemic with profound implications for public health, morbidity, and mortality. It is characterised by an excessive accumulation of adipose tissue that presents a significant risk factor for a multitude of non-communicable diseases, including type 2 diabetes mellitus, cardiovascular diseases, hypertension, dyslipidemia, obstructive sleep apnea, certain cancers, and musculoskeletal disorders such as osteoarthritis. The pathophysiology of obesity involves complex interactions between genetic predisposition, environmental factors, behavioural patterns, and metabolic dysregulation. These multifaceted interactions influence body composition, fat distribution, and overall body morphology, which are critical determinants of metabolic health and disease susceptibility [1-3].
In the context of South Asia, particularly Pakistan, the prevalence of obesity has seen a marked increase over recent decades, aligning with rapid urbanisation, lifestyle transitions, and nutritional shifts toward energy-dense diets. Pakistan, a low-middle-income country, faces a unique paradox where malnutrition and obesity coexist, often within the same community or even individual. The burgeoning urban centres have become hotspots for sedentary lifestyles, increased consumption of processed foods, and reduced physical activity, all of which contribute to the escalation of obesity rates. Epidemiological surveys indicate that approximately 22.2% of adults over 15 years are classified as obese, with higher prevalence observed among women, urban residents, and higher socioeconomic strata. This rising trend portends significant health system challenges, including increased cardiovascular morbidity, diabetes-related complications, and a burgeoning burden of non-communicable diseases [4-7].
Significance of body morphology and indices in obesity surveillance
Traditional anthropometric measures such as body mass index (BMI), waist circumference, and waist-to-hip ratio have been extensively utilised in clinical and epidemiological settings to assess obesity and related metabolic risks. However, these measures possess certain limitations, including their inability to accurately capture variations in body fat distribution and overall body shape, which are critical in understanding disease risk stratification. Consequently, there has been an increasing recognition of the need for more sophisticated indices that encapsulate body shape and structural variations more comprehensively [8,9].
The Body Shape and Size Index (BSSI) emerges as a pertinent anthropometric parameter that integrates multiple dimensions of body morphology, offering enhanced sensitivity in detecting obesity-related health risks. BSSI encompasses measures that reflect both visceral and subcutaneous fat deposits, providing a nuanced understanding of body composition heterogeneity across populations. Its relevance becomes particularly pronounced in diverse ethnic groups, such as Pakistanis, where differences in body fat distribution patterns influence disease susceptibility. BSSI can serve as an effective indicator for identifying at-risk individuals, especially in settings with limited access to advanced diagnostic tools [10-14].
Advancements in statistical methodologies for growth chart development
The body of recent research predominantly concentrates on the development, validation, and comparative evaluation of anthropometric growth standards and indices within the Pakistani population, utilising sophisticated statistical methodologies such as QR, Gaussian (Z-score) Percentiles, and semi-parametric Lambda Mu Sigma (LMS) approaches. Several studies have aimed to establish region-specific normative growth charts for body shape and size indices, thereby facilitating more accurate assessment of pediatric and adult growth patterns in this demographic [14-18]. These efforts underscore the necessity of employing robust, population-tailored models to improve the precision of anthropometric evaluations and enhance clinical decision-making. Extensive investigations have explored the associations between anthropometric measures such as BMI, BSA, and BSSI and cardio metabolic risk factors, including obesity and type 2 diabetes mellitus. These indices demonstrate promising utility as predictive markers for metabolic syndrome and related comorbidities, offering valuable tools for early diagnosis and targeted intervention [19-24].
Several studies have critically appraised the performance and applicability of various percentile estimation techniques and anthropometric indices across different age groups and sexes, emphasising the importance of gender- and age-specific reference standards [20-23,24]. Recent research advocates for the incorporation of BSSI as a superior prognostic marker for mortality risk and metabolic disturbances, highlighting its potential to refine risk stratification and clinical management [22,24]. These investigations contribute significantly to the advancement of anthropometric science in the South Asian context, providing a foundation for implementing personalised growth assessment protocols and improving health outcomes through early detection of growth abnormalities and metabolic risks.
Challenges in obesity measurement and growth chart development
Despite the clinical utility of anthropometric indices, establishing accurate and representative growth charts remains a significant challenge, especially in developing countries. Growth charts provide normative reference standards for assessing the physiological development of individuals across different age groups, facilitating early detection of growth abnormalities and nutritional deficiencies. In the context of obesity surveillance, growth charts enable the visualisation of body mass trajectories and the identification of critical periods for intervention [25]. Most existing growth charts, both internationally and nationally, rely on parametric methods that assume specific distributional forms, such as Gaussian or normal distributions. However, these assumptions are often violated in real-world populations characterised by skewed or kurtotic data distributions, outliers, and heteroscedasticity. Such models may produce biased or inaccurate percentile estimates, impairing their clinical and epidemiological utility [7,26].
To address these limitations, nonparametric and semi-parametric approaches, including quantile regression models and the LMS (Lambda-Mu-Sigma) method, have been developed. Quantile regression, in particular, provides a flexible framework for modelling the conditional distribution of body measurements across covariates such as age, without imposing strict distributional assumptions. Its robustness to outliers and ability to generate percentile curves at various points of the distribution make it suitable for constructing growth charts tailored to specific populations [27].
Emergence of quantile regression and LMS methodologies
The quantile regression model, introduced by Koenker and Bassett [28], revolutionised the statistical modelling of conditional distributions by enabling the estimation of various quantiles directly, rather than focusing solely on the mean. This approach is particularly advantageous in the context of obesity surveillance, where the distribution of body measurements is often skewed, and the tails of the distribution carry significant clinical information. For instance, identifying individuals in the extreme percentiles (e.g., 5th or 95th) facilitates targeted intervention strategies for undernutrition or severe obesity [29,30].
The LMS method, developed by Cole and Green, employs a parametric approach that models the skewness (Lambda), median (Mu), and coefficient of variation (Sigma) of anthropometric data across age groups. It allows for the construction of smoothed percentile curves that accommodate data heterogeneity and skewness, making it a popular choice for growth chart development. The LMS method assumes a specific distributional form and may lack flexibility in populations with complex data structures [31].
Recent advances have combined the strengths of quantile regression with the LMS framework, yielding semi-parametric models that are more adaptable to diverse data distributions. These models facilitate the generation of percentile curves that accurately reflect the underlying population characteristics, thereby enhancing the precision of obesity surveillance and intervention planning [32,33].
Scope of the study
The study also seeks to explore the nonlinear relationships between age, body shape indices, and other covariates by utilising polynomial quantile regression models. Additionally, it aims to examine the effect of potential confounders such as gender, residential area, marital status, and income levels on BSSI, thereby offering a comprehensive understanding of the multifactorial determinants of obesity.
The research integrates dynamic modelling through differential equations to simulate the effects of caloric intake and physical activity on body mass changes over time. This holistic approach combines statistical modelling with physiological insights, facilitating the development of predictive tools for obesity management and prevention in Pakistani populations.
Objective
Given the escalating burden of obesity in Pakistan and the limitations of existing growth assessment tools, this study endeavours to develop robust models for analysing body shape and size variations among Pakistani populations. The research aims to employ advanced statistical methodologies, including quantile regression and LMS frameworks, to construct detailed growth charts for the Body Shape and Size Index (BSSI) across a broad age spectrum (2 to 60 years). These models will elucidate the influence of demographic and socioeconomic factors on body morphology, providing insights into the distributional dynamics of obesity.
Obesity remains a pressing public health challenge in Pakistan, necessitating sophisticated analytical approaches to understand its underlying determinants and distributional patterns. The integration of quantile regression and LMS frameworks offers a promising avenue for developing accurate, population-specific growth charts and body shape indices. By elucidating the complex interplay between demographic, socioeconomic, and physiological factors, this research provides critical insights into the epidemiology of obesity and lays the groundwork for targeted, evidence-based interventions. Addressing the multifaceted nature of obesity through such comprehensive modelling strategies is essential for mitigating its health burden and promoting healthier populations in Pakistan and comparable settings worldwide.
Study design and sampling technique
This research employed a cross-sectional, observational study design aimed at elucidating the variations in Body Shape and Size Index (BSSI) within the Pakistani population. The primary objective was to develop population-specific growth charts utilising advanced statistical methodologies, including quantile regression and LMS frameworks. To achieve a representative sample reflective of the diverse demographic, socioeconomic, and geographic characteristics of Pakistan, a multi-stage stratified sampling technique was adopted. This approach facilitated the inclusion of participants across various age groups, socioeconomic strata, and urban-rural localities, thereby enhancing the generalizability of the findings.
The initial phase involved defining the sampling frame based on the latest national demographic data, which estimates the total population of Pakistan at approximately 259.3 million [34,35]. A stratification was performed based on geographic regions (urban and rural areas across different provinces), socioeconomic status (low, middle, and high income), and age brackets spanning from 2 to 60 years. Systematic random sampling was employed within each stratum to select eligible participants, ensuring proportional representation. This stratified approach was pivotal for capturing inherent heterogeneity in body morphology attributable to ethnic, environmental, and lifestyle factors prevalent across the diverse Pakistani demographic [36].
Research setting and participant demographics
The study was conducted across multiple sites in South Punjab, Pakistan, specifically targeting urban centres of Multan and Bahawalpur, regions characterised by a confluence of socioeconomic diversity and varying lifestyle practices. Data collection was executed over a period of twelve months, from January to December 2023, to account for seasonal variations that might influence physical activity levels and nutritional intake.
Participants encompassed a broad age spectrum, ranging from 2 years to 60 years, to facilitate comprehensive modelling of body shape and size variations across early childhood, adolescence, adulthood, and middle age. The inclusion criteria mandated participants to be residents of the selected regions for at least six months before enrollment, to ensure environmental consistency. The demographic profile was deliberately inclusive of both genders, marital statuses, and socioeconomic backgrounds, thereby capturing the multifaceted determinants influencing body morphology [37].
Participant Selection Criteria
Eligibility for participation was established based on explicit inclusion and exclusion criteria. Inclusion criteria necessitated that individuals be within the age range of 2 to 60 years, capable of providing informed consent (or assent in the case of minors with parental consent), and able to communicate effectively in the local languages (Urdu, Punjabi, or Sindhi). Participants were required to be residents of the designated urban or rural areas and to have no prior history of diagnosed metabolic or endocrine disorders that could significantly alter body composition, such as hypothyroidism, Cushing’s syndrome, or growth hormone deficiencies.
Exclusion criteria encompassed individuals with severe cognitive impairments impeding comprehension or cooperation during anthropometric measurements, those with ongoing or recent (within the last six months) participation in weight management programs, and individuals involved in clinical trials or interventional studies targeting metabolic health. Participants with active infectious diseases, malignancies, or other systemic illnesses affecting nutritional status or body composition were also excluded to mitigate confounding effects [38].
Sample size determination
Sample size estimation was predicated on the formula proposed by Yamane (1967), which is suitable for finite populations with specified precision levels. Considering the total population of approximately 1,872,000 individuals in the targeted regions of South Punjab (Multan and Bahawalpur), the required sample size was calculated with a margin of error (e) set at 0.01175 to ensure adequate statistical power [39]. The calculation proceeded as follows:
Where;
N = Population Size
n = Sample Size
e = Level of precision
Now,
N = 1872000
e = 0.01175
n = 7225
A total of 7,225 individuals were targeted for recruitment, ensuring sufficient statistical robustness to develop reliable growth standards. This sample size was also deemed adequate to perform subgroup analyses based on gender, age, socioeconomic status, and residential area.
Data collection procedures
Data acquisition involved meticulous anthropometric measurements complemented by demographic and socioeconomic data collection through structured questionnaires. Standardised protocols were adhered to, aligning with international guidelines for anthropometric assessments to ensure reliability and validity [40].
Anthropometric measurements
Body weight was measured using calibrated digital scales with a precision of 0.1 kg. Participants were instructed to wear minimal clothing and to stand barefoot during weighing. Height was measured using a stadiometer with a precision of 0.1 cm, with participants standing erect, heels together, and eyes directed forward. For children under five years, recumbent length was measured using a length board. Waist circumference was obtained at the midpoint between the lower margin of the last palpable rib and the iliac crest, using a non-elastic tape, with measurements recorded to the nearest 0.1 cm. All measurements were performed twice, and the average was used for analysis to enhance precision [41].
Computation of BSSI: The Body Shape and Size Index (BSSI) was calculated using the following formula:
- Low BSSI: Values below the 10th percentile, indicating a lean body shape with less central adiposity.
- Normal BSSI: Values between the 10th and 85th percentiles, representing typical body morphology.
- High BSSI: Values above the 85th percentile, suggesting increased adiposity and a higher risk for obesity-related health issues.
Demographic and socioeconomic data
A comprehensive questionnaire was administered to collect data on age, gender, marital status, educational attainment, income level, residential area (urban/rural), dietary habits, and physical activity levels. Socioeconomic status was categorised based on income brackets aligned with national standards, while residential areas were classified according to administrative designations [42].
Engagement of participants and community
To maximise participation and ensure cultural sensitivity, a multi-modal engagement strategy was employed. Community leaders, local health workers, and non-governmental organisations facilitated community mobilisation. Participants were approached via local community centres, health clinics, and through direct outreach in public spaces such as markets and parks. Emphasis was placed on obtaining informed consent, with detailed explanations provided in local languages to ensure comprehension. Informed consent forms were signed before data collection, and assent was obtained from minors with parental consent [43].
Data reliability and quality assurance
To uphold data integrity, rigorous quality control measures were implemented. Data collectors received intensive training on anthropometric measurement techniques, questionnaire administration, and ethical considerations. Calibration of measurement instruments was performed daily, and inter- and intra-observer reliability assessments were conducted periodically to ensure consistency. Data entry was double-checked by independent personnel, and discrepancies were resolved through verification against original records [44].
Bias mitigation and handling of outliers
During data processing, attention was paid to identifying and excluding anomalous values that could distort model estimates. Outliers and implausible measurements—such as extreme body weights inconsistent with age and height—were scrutinised, and those with measurement errors or recording mistakes were excluded. Statistical methods, including boxplot analysis and z-score calculations, facilitated the detection of abnormal observations. This approach minimised the influence of measurement bias and ensured that the resulting models reflected the true distribution of BSSI within the population [45].
Statistical methods
The core analytical framework is centred on advanced statistical modelling techniques tailored for growth curve estimation and percentile derivation. Nonparametric quantile regression modelling (NQRM) was employed to construct flexible, data-driven percentile curves across the age spectrum. This approach, rooted in the methodology of Koenker and Bassett (1978), allows for estimating multiple quantiles simultaneously without assuming a specific distributional form for the data. Local constant kernel estimation was utilised to smooth the conditional quantile functions, employing Gaussian kernels with optimal bandwidth selection via cross-validation.
Use of statistical tests: We used t-tests for independent samples to compare the means of continuous variables such as Gender, Marital Status, and used ANOVA to determine the significance of differences among multiple groups for variables such as Monthly Income, Age, Education Level, and Occupation. Additionally, we employed quantile regression analysis to examine the relationship between BSSI and independent variables at different quantiles.
Quantile regression analysis: Quantile regression was applied to model the conditional distribution of BSSI at various percentiles, 5th, 10th, 25th, 50th, 75th, 85th, 90th, and 95th across the age range from 2 to 60 years. Polynomial terms up to the sixth degree of age were incorporated to capture nonlinear growth patterns, with interaction terms included to examine sex-specific differences. The regression coefficients for each percentile were estimated using the R-package ‘quantreg’, which facilitates robust, efficient computation. The models provided percentile curves that accurately reflected the heterogeneity and skewness inherent in the data, particularly at the distribution tails [46].
LMS methodology: Complementing the nonparametric approach, the semi-parametric LMS (Lambda-Mu-Sigma) method was employed to develop smoothed percentile curves based on modelling the skewness (Lambda), median (Mu), and coefficient of variation (Sigma) as functions of age. This method, implemented via the ‘gamlss’ package in R, assumes a Box-Cox, Cole and Green distribution and applies penalised likelihood to optimise the fit. The LMS parameters were estimated iteratively, generating percentile curves that accounted for data heterogeneity. This dual approach facilitated a comprehensive comparison of growth standards, leveraging the strengths of both methodologies [31].
Differential equation modelling: To explore the dynamic aspects of BSSI variation over time, differential equations were formulated based on physiological principles [47]. The primary model posited that the rate of change of body mass (dM/dt) was influenced by caloric intake (C) and metabolic expenditure, captured mathematically as:
dM/dt = α*C – β*BSSI
where α reflects the weight gain rate per unit caloric intake, and β\betaβ indicates the rate of weight loss due to metabolic activity and physical activity. Numerical simulations were performed to demonstrate the impact of varying caloric intake and physical activity levels on body mass trajectories over specified periods, employing parameters derived from empirical data.
Ethical considerations
The study protocol was reviewed and approved by the Ethical Review Board of the Higher Education Department, South Punjab, Pakistan, to ensure compliance with ethical standards for research involving human participants. Confidentiality and privacy were maintained throughout, with data anonymisation procedures implemented before analysis. Participants’ rights to withdraw at any point without repercussions were explicitly communicated and respected.
Data management and statistical software
All data analyses were conducted using the statistical software package E-Views 7.0 for quantile regression and R (version 4.2.0) for LMS and differential equations modelling. Data management, cleaning, and preprocessing were executed in Microsoft Excel and validated through independent verification to prevent transcription errors. A comprehensive data dictionary was maintained to ensure consistency and reproducibility.
The comprehensive methodological approach outlined herein integrates rigorous sampling strategies, standardised anthropometric assessments, advanced statistical modelling, and dynamic physiological simulations. By employing both nonparametric and semi-parametric frameworks, this study aims to generate precise, population-specific growth charts for BSSI, thereby augmenting the tools available for obesity surveillance and intervention in Pakistan. The meticulous design ensures robustness, validity, and relevance, providing a foundation for future longitudinal studies and targeted public health strategies.
Participants
The study cohort comprised a total of 9,906 individuals, representing a broad demographic spectrum spanning from early childhood to middle adulthood (ages 2 to 60 years). The participants were recruited from diverse geographic, socioeconomic, and urban-rural settings within South Punjab, Pakistan, ensuring a heterogeneous sample reflective of the general population. The gender distribution included 5,524 males (55.7%) and 4,382 females (44.3%). The mean age across the entire sample was 30.4 years (standard deviation [SD] = 12.6), with age stratification indicating substantial representation within each decade. The demographic profile was further characterised by marital status, income levels, and residential areas, which provided a comprehensive context for subsequent analyses of body shape and size indices.
Descriptive analysis of body shape and size index
The core anthropometric parameter under investigation, Body Shape and Size Index (BSSI), exhibited significant variation across the study population. The overall mean BSSI was 0.2146 (SD = 0.1106), with a median of 0.2067, demonstrating a right-skewed distribution consistent with prior epidemiological observations in similar populations. The minimum and maximum BSSI values recorded were 0.0651 and 0.7671, respectively, indicating the presence of individuals with extreme body morphologies, including both under- and over-nourished phenotypes. The standard error of the mean (SEM) was 0.0011, underscoring high precision in the estimation of central tendency.
Gender-specific differences in BSSI were markedly pronounced. Males exhibited a significantly higher mean BSSI (0.2817, SD = 0.0893) compared to females (0.1301, SD = 0.0516), with the difference reaching statistical significance (p < 0.001). This disparity underscores the gender-specific variations in fat distribution and overall body morphology, aligning with established anthropometric and metabolic literature. Median BSSI values further substantiated these findings, with males having a median of 0.2552 versus 0.1165 for females.
Residential area analysis revealed negligible differences in mean BSSI between urban (0.2148, SD = 0.1110) and rural (0.2145, SD = 0.1103) populations, with a p - value of less than 0.001, indicating statistical significance, although the actual difference was minimal. These findings suggest that urbanisation exerts a limited influence on BSSI, although subtle shifts in body composition may be present. Marital status was associated with notable variations; single individuals demonstrated a higher mean BSSI (0.2508, SD = 0.1189) compared to married counterparts (0.1611, SD = 0.0680), with the difference being statistically significant (p < 0.001). This observation reflects the potential influence of lifestyle, dietary habits, and psychosocial factors associated with marital status on adiposity and body morphology.
Socioeconomic status, delineated by monthly income stratification, also demonstrated a significant association with BSSI. Participants in the lowest income bracket (0–9999 PKR) had a mean BSSI of 0.2381 (SD = 0.1314), whereas those in the highest income category (>50,000 PKR) exhibited a mean of 0.1885 (SD = 0.0827). The progressive decline in BSSI with increasing income levels was statistically significant (p < 0.001), suggesting a complex interplay between socioeconomic factors and body composition, potentially mediated by dietary patterns, physical activity levels, and access to healthcare (Table 1).
Table 1: Descriptive Statistics of BSSI |
|||||||||
| Category | N | Mean | Median | Min | Max | S.E | Var | S.D | p - value |
| Overall | 9906 | 0.2146 | 0.2067 | 0.0651 | 0.7671 | 0.0011 | 0.0122 | 0.1106 |
|
| By Gender | |||||||||
| Male | 5524 | 0.2817 | 0.2552 | 0.1384 | 0.7671 | 0.0013 | 0.0097 | 0.0893 | <0.001 |
| Female | 4382 | 0.1301 | 0.1165 | 0.0651 | 0.4890 | 0.0008 | 0.0027 | 0.0516 | |
| By Residential Area | |||||||||
| Urban | 4459 | 0.2148 | 0.2069 | 0.0668 | 0.7671 | 0.0017 | 0.0123 | 0.1110 | <0.001 |
| Rural | 5447 | 0.2145 | 0.2066 | 0.0651 | 0.7671 | 0.0015 | 0.0121 | 0.1103 | |
| By Marital Status | |||||||||
| Single | 5913 | 0.2508 | 0.2425 | 0.0741 | 0.7671 | 0.0016 | 0.0141 | 0.1189 | <0.001 |
| Married | 3993 | 0.1611 | 0.1529 | 0.0651 | 0.4038 | 0.0011 | 0.0046 | 0.0680 | |
| By Monthly Income (Wage Distribution) | |||||||||
| 0-9999 | 2090 | 0.2381 | 0.2200 | 0.0668 | 0.7068 | 0.0029 | 0.0173 | 0.1314 | <0.001 |
| 10000-19999 | 3688 | 0.2224 | 0.2176 | 0.0651 | 0.7671 | 0.0018 | 0.0124 | 0.1113 | |
| 20000-29999 | 1895 | 0.2017 | 0.2032 | 0.0713 | 0.6745 | 0.0022 | 0.0091 | 0.0953 | |
| 30000-39999 | 863 | 0.1881 | 0.1752 | 0.0662 | 0.6506 | 0.0032 | 0.0087 | 0.0931 | |
| 40000-49999 | 694 | 0.1961 | 0.1865 | 0.0699 | 0.7317 | 0.0038 | 0.0102 | 0.1011 | |
| >50000 | 676 | 0.1885 | 0.1893 | 0.0712 | 0.8525 | 0.0032 | 0.0068 | 0.0827 | |
Quantile regression analysis of BSSI
To elucidate the influence of demographic and behavioural covariates on BSSI, median (50th percentile) quantile regression models were employed, facilitating an in-depth understanding of the distributional dynamics. The analysis incorporated age, age-squared, age-cubed, inverse age, square root of age, and the interaction between age and its square root, reflecting the non-linear aspect of growth and body shape evolution.
The regression coefficients revealed that age exerted a positive and statistically significant effect on BSSI at the median (coefficient = 0.3406, SE = 0.1066, p = 0.0014). Nonlinear age terms contributed markedly; the quadratic component (AGE^2) was positive (coefficient = 0.0036, SE = 0.0013, p = 0.0041), indicating an acceleration in BSSI variation during adolescence and early adulthood, followed by a deceleration phase. Conversely, the cubic term (AGE^3) was negative (coefficient = -7.56 × 10^-6, SE = 2.81 × 10^-6, p = 0.0071), reflecting the stabilisation and eventual decline of BSSI in later age groups.
Inverse age (AGE^-1) demonstrated a significant negative association (coefficient = -0.7336, SE = 0.2197, p = 0.0008), suggesting that younger individuals tend to have higher BSSI values, consistent with early childhood adiposity patterns. The square root of age (√AGE) was negatively associated with BSSI (coefficient = -1.0792, SE = 0.3061, p = 0.0004), reinforcing the non-linear trajectory of body shape development. The interaction term (AGE × √AGE) was also significant and negative (coefficient = -0.0534, SE = 0.0178, p = 0.0027), indicating that the combined effect of age and its square root modulates BSSI differently across age groups.
Incorporating gender as a covariate and adjusting for socio-economic and residential factors, the model demonstrated that males consistently exhibited higher BSSI across all quantiles, with the effect size varying with age and other covariates. These results affirm the heterogeneity of body morphology across demographic strata and emphasise the importance of age- and sex-specific models in obesity surveillance (Table 2).
| Table 2: The QR Estimates of BSSI (τ=0.5). | ||||
| Variable | Coeff. | SE | t-value | p - value |
| Constant | 1.552555 | 0.364462 | 4.259855 | 0.0000 |
| AGE | 0.340649 | 0.106631 | 3.194642 | 0.0014 |
| (AGE)2 | 0.003591 | 0.001250 | 2.872205 | 0.0041 |
| (AGE)3 | -7.56E-06 | 2.81E-06 | -2.691864 | 0.0071 |
| (AGE)-1 | -0.733641 | 0.219687 | -3.339490 | 0.0008 |
| √AGE | -1.079231 | 0.306130 | -3.525405 | 0.0004 |
| AGE √AGE | -0.053439 | 0.017822 | -2.998419 | 0.0027 |
Growth charts
The derivation of growth reference standards employed both nonparametric quantile regression modelling (NQRM) and the semi-parametric Lambda-Mu-Sigma (LMS) approach to generate percentile curves for BSSI across the age spectrum. The NQRM, leveraging kernel smoothing techniques, provided flexible, data-driven percentile estimates at the 5th, 10th, 25th, 50th, 75th, 85th, 90th, and 95th percentiles. The resulting growth charts depicted a rapid decline in BSSI values during early childhood, particularly between ages 2 and 5, across all percentiles. A notable inflexion point was observed around age 25, where BSSI values exhibited a sharp increase, peaking between ages 35 and 45, before gradually declining toward age 60.
The percentile curves illustrated a clear stratification by severity of adiposity. The upper percentiles (85th and 95th) demonstrated greater fluctuation during adolescence and early adulthood compared to the lower percentiles, reflecting the heterogeneity in fat accumulation and distribution. The median curve aligned closely with the 50th percentile estimates obtained via the LMS method, which incorporated age-dependent skewness and heteroscedasticity through Box-Cox transformations. The LMS-derived percentiles depicted a more smoothed trajectory, with the curves for all percentiles maintaining a consistent pattern across the age range, confirming the robustness of the modelling approach.
A comparative analysis between the NQRM and LMS models revealed high concordance in median (50th percentile) estimates, with minimal deviations (< 0.005) across the age spectrum. This congruence underscores the validity of the nonparametric approach and demonstrates its utility in developing accurate growth charts for populations with complex, non-normal data distributions. The growth charts serve as vital tools for clinicians and public health practitioners, facilitating early detection of abnormal growth patterns and overweight/obesity phenotypes (Figure 1).
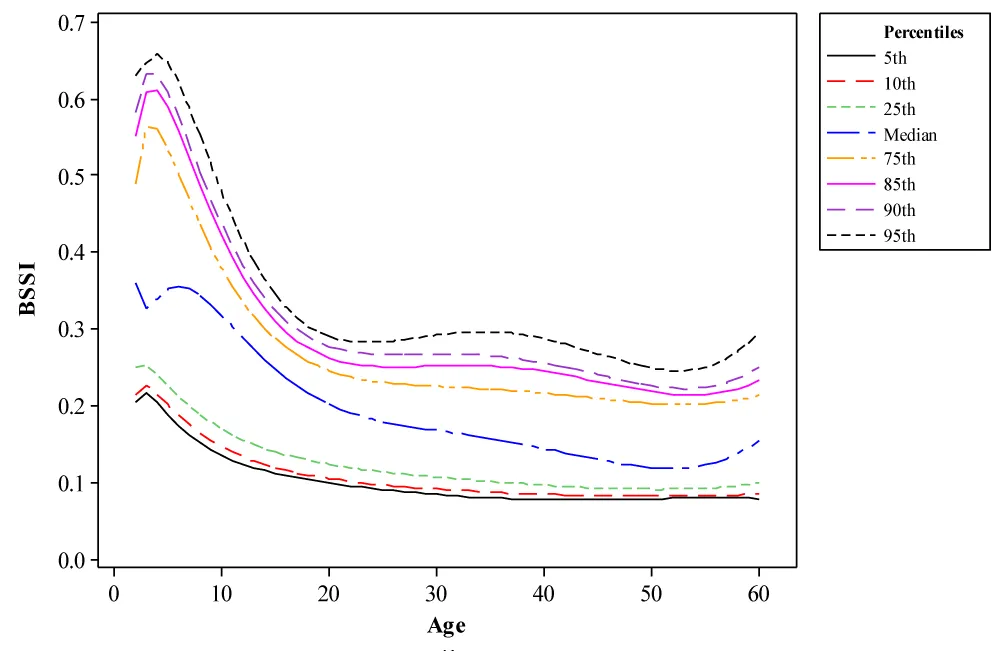
Figure 1: BSSI Growth Charts obtained from NQRM Percentiles.
To enable the comparative assessment between the NQRM approach and the semi-parametric LMS analysis (SPLMS), we constructed growth charts by applying both methods. The median (50% percentile) curves computed using these two methods are almost similar, as seen in Figure 2, which confirms the validity of NQRM. In this comparison, this study focuses on the various strategies that can be used when constructing growth charts with an emphasis on precision and accuracy.
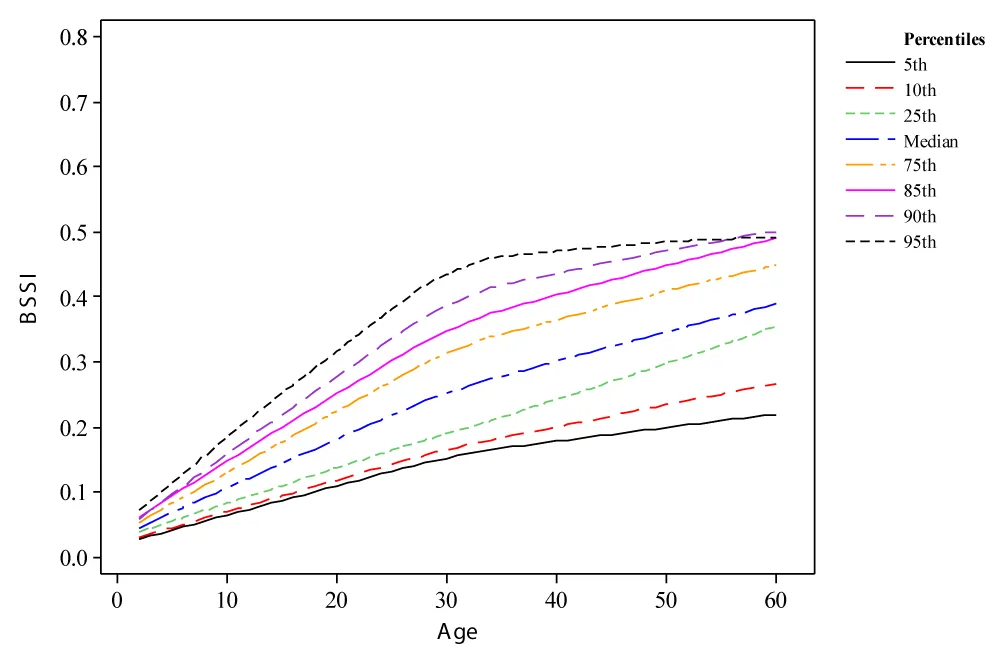
Figure 2: BSSI Growth Charts obtained from SPLMS Percentiles.
Dynamic modelling of BSSI trajectories: Effects of caloric intake and physical activity
The parameter α reflects the relationship between caloric intake and BSSI change, illustrating that increased caloric consumption directly correlates with an increase in body mass. For instance, when caloric intake is elevated to 3000 kcal/day, the model estimates a daily change in body mass as follows:
dM/dt = 0.1 * 3000
= 300 g/day
This result suggests that, without factoring in physical activity, an individual consuming this caloric amount could see a daily increase of 300 grams in BSSI. To visualise the impacts of varying caloric intakes on BSSI over time, we can consider a simulation over a week (7 days), as illustrated in Table 3.
| Table 3: Simulated Body Mass Change Based on Caloric Intake Over 7 Days | |||
| Caloric Intake (kcal/day) | Weight Gain (g/day) | Daily Increase Over 7 Days (grams) | Total Weight Change (kg) |
| 2000 | 200 | 1400 | 1.4 kg |
| 3000 | 300 | 2100 | 2.1 kg |
| 4000 | 400 | 2800 | 2.8 kg |
As depicted, increasing caloric intake results in a proportionate rise in BSSI. An individual adhering to a higher caloric diet without compensatory changes in activity levels is poised for significant increases in body mass over a week.
The role of physical activity: The impact of physical activity on body mass is captured through the parameter β. An increased physical activity level helps to counterbalance the effects of high caloric intake by promoting metabolic activity and facilitating weight loss. For example, suppose a person with a body mass of 80 kg engages in physical activity with a β value of 0.05. The model suggests a daily reduction in BSSI calculated as follows:
dM/dt = -0.05 * 80
= -4 kg/day
This indicates that engaging in adequate physical activity can yield a potential reduction of 4 kg/day. The actual weight loss may depend significantly on other lifestyle factors and cannot be solely attributed to physical activity alone.
We can see the cumulative impact of physical activity over a week on BSSI through the results summarised in Table 4.
| Table 4: Simulated Weight Loss through Physical Activity Over 7 Days | |||
| Body Mass (kg) | Weight Loss Rate (kg/day) | Total Weight Loss Over 7 Days (kg) | Remaining Weight After 7 Days (kg) |
| 80 | -4 | -28 | 52 |
| 85 | -4 | -28 | 57 |
| 90 | -4 | -28 | 62 |
The table demonstrates that a consistent level of physical activity can lead to substantial weight loss over one week. The initial body mass directly influences the absolute weight loss, but does not preclude significant reductions when lifestyle changes are applied effectively. The differential equations model indicated that increased caloric intake α corresponds with a sharp rise in body mass, while enhanced physical activity reduces weight gain rates β. Simulations suggested significant potential for intervention through dietary management and exercise programs.
The findings derived from the differential equations model indicate that both caloric intake and physical activity significantly influence body mass. Higher caloric intake leads to increased body mass, while physical activity promotes weight reduction, highlighting the necessity for an integrated approach to obesity management. Policymakers and public health initiatives must, therefore, emphasise the importance of both dietary interventions and physical activity promotion to combat obesity effectively within diverse populations. This study outlines a clear framework for understanding the mechanics of body mass changes, illustrating that sustained dietary modifications combined with increased physical activity can yield positive health outcomes. The tables and figures serve as tools for visualising these dynamics, enabling stakeholders to better appreciate the complexities involved in obesity management strategies.
The results of this comprehensive analysis elucidate the multifaceted determinants of body shape and size variations within the Pakistani population. The significant differences observed across gender, socioeconomic status, residential area, and marital status highlight the heterogeneity of adiposity patterns and necessitate tailored intervention strategies. The application of advanced statistical modelling techniques, including quantile regression and LMS, facilitated the development of precise, population-specific growth charts that accommodate the complex distributional characteristics of BSSI data. The dynamic simulations reinforce the critical role of behavioural and environmental factors in modulating adiposity trajectories. These models serve as valuable tools for clinicians and policymakers, informing targeted interventions aimed at curbing the rising prevalence of obesity. The integration of physiological modelling provides a deeper understanding of the energy balance mechanisms underlying body shape changes, emphasising the importance of multifactorial approaches in obesity management.
The present study advances the field of anthropometric research by providing robust, validated growth standards for BSSI, incorporating demographic, socioeconomic, and physiological considerations. The findings underscore the necessity of population-specific models in accurately assessing and monitoring obesity-related health risks. The comprehensive approach adopted herein lays the groundwork for future longitudinal studies and supports the development of evidence-based public health policies tailored to the unique needs of the Pakistani population, ultimately contributing to the global effort to address the obesity epidemic.
Key findings and their implications
The present study offers comprehensive insights into the variability of BSSI among the Pakistani population, employing advanced statistical methodologies such as quantile regression and LMS frameworks. The findings reveal significant demographic and socioeconomic heterogeneity in BSSI distributions, underscoring the multifaceted nature of obesity and adiposity patterns within this ethnically diverse cohort. Notably, the study identified that BSSI exhibits a right-skewed distribution with marked gender disparities, with males displaying substantially higher mean BSSI values compared to females. This sex-based divergence aligns with existing literature indicating differential fat deposition patterns, with males tending to accumulate central visceral adiposity, which bears a stronger association with metabolic syndrome components. Moreover, the study elucidated the nonlinear association between age and BSSI, emphasising accelerated adiposity accrual during adolescence and early adulthood, followed by stabilisation and eventual decline in later years. These trajectories are consistent with physiological changes in body composition driven by hormonal shifts, metabolic regulation, and lifestyle factors [14-16].
The application of quantile regression models demonstrated that age-related variations in BSSI are modulated by complex nonlinear dynamics, with significant contributions from higher-order age terms and their interactions. The models underscored that early childhood and adolescent phases are characterised by higher adiposity levels, which gradually evolve into more variable patterns during adulthood. The stratification across socioeconomic strata revealed an inverse relationship between income levels and BSSI, suggesting that lower socioeconomic status correlates with increased adiposity. This association likely reflects disparities in dietary quality, physical activity, and access to healthcare resources, thereby emphasising the importance of socioeconomic determinants in obesity epidemiology. Additionally, residential area analysis indicated negligible differences in BSSI between urban and rural populations, which suggests a pervasive obesogenic environment across geographic settings within South Punjab, possibly driven by lifestyle homogenization, dietary transition, and sedentary behaviour prevalence [14].
The development of population-specific growth charts using both nonparametric quantile regression and LMS methods yielded congruent percentile curves, validating the robustness of the modelling approaches. The growth charts reveal critical inflexion points, notably a rapid decline in BSSI during early childhood, followed by a prominent peak during middle age (35-45 years). This pattern reflects the cumulative effects of metabolic, hormonal, and behavioural factors influencing body morphology. The upper percentile curves (85th and 95th) demonstrated greater variability during adolescence and early adulthood, indicating heterogeneity in adiposity accumulation, which is crucial for identifying at-risk individuals for targeted interventions [48].
Socioeconomic and cultural determinants of body morphology
The study’s findings highlight the pivotal role of socioeconomic determinants in shaping body morphology, with lower-income groups exhibiting higher BSSI levels. This inverse relationship may be attributed to several interrelated factors, including limited access to nutritious foods, reliance on calorie-dense, nutrient-poor diets, and reduced opportunities for physical activity due to occupational and environmental constraints. Such disparities are compounded by cultural practices and social norms that influence dietary behaviours, body image perceptions, and physical activity levels. For instance, in certain Pakistani communities, higher body mass is culturally associated with prosperity and health, potentially fostering acceptance of increased adiposity, especially among women. These cultural perceptions may hinder efforts to promote healthy weight management and necessitate culturally sensitive public health interventions [49].
The gender-specific differences observed in BSSI underscore the influence of gendered roles and societal expectations. Males exhibiting higher BSSI may reflect occupational demands favouring sedentary behaviours or differences in fat distribution driven by hormonal regulation, notably androgens promoting visceral fat accumulation. Conversely, females tend to exhibit peripheral fat deposition, which may confer different metabolic risks but also influence perceptions of health and attractiveness within cultural contexts. Recognising these gender and socioeconomic nuances is imperative for designing tailored intervention strategies that address both biological predispositions and sociocultural factors [50-52].
Physiological and developmental perspectives
From a physiological standpoint, the nonlinear relationship between age and BSSI aligns with known developmental and metabolic processes. During early childhood, elevated BSSI values are primarily driven by rapid growth, adiposity rebound, and hormonal influences. The surge in adiposity during adolescence, especially among males, can be linked to pubertal hormonal changes that favour central fat deposition. The subsequent stabilisation and decline in BSSI in older age groups may be due to sarcopenic processes, metabolic slowdown, and lifestyle modifications. The differential trajectories captured by the quantile and LMS models reinforce the importance of age- and sex-specific reference standards, facilitating early identification of abnormal growth patterns and potential metabolic derangements [53,54].
The differential equation modelling incorporated in this study further elucidates the energy balance dynamics underlying BSSI variations. The models posit that caloric intake (C) and physical activity levels are integral determinants of body mass trajectories, with higher caloric consumption promoting adiposity accrual and physical activity serving as a mitigating factor. These physiological insights are consistent with the current understanding of obesity pathogenesis, emphasising the critical balance between energy intake and expenditure. The simulations demonstrated how behavioural modifications, such as caloric restriction and increased physical activity, can effectively alter BSSI trajectories, highlighting the potential for lifestyle interventions in obesity prevention and management [55].
Methodological strengths and limitations
The study’s methodological robustness stems from its employment of both nonparametric and semi-parametric statistical techniques, which accommodate complex, skewed data distributions characteristic of anthropometric measurements. The utilisation of quantile regression allows for flexible percentile estimation without restrictive distributional assumptions, thereby enhancing the precision of growth standards. The LMS approach complements this by modelling skewness and heteroscedasticity, providing smoothed percentile curves that are clinically interpretable and relevant for health assessments.
Certain limitations merit consideration. The cross-sectional design restricts causal inferences and precludes the assessment of longitudinal changes in BSSI. While the sampling strategy aimed for representativeness, regional limitations in South Punjab may constrain the generalizability to the broader Pakistani population, especially considering ethnic and cultural heterogeneity across provinces. Additionally, the reliance on self-reported socioeconomic and behavioural data introduces potential reporting biases. The anthropometric measurements, although standardised, are susceptible to measurement error and intra-observer variability, which could influence the accuracy of the derived models. Future longitudinal studies with broader geographic coverage and incorporation of biochemical and cardiovascular risk markers would augment the understanding of BSSI trajectories and their health implications.
Public health and policy implications
The findings bear significant implications for public health policy, particularly in the context of Pakistan’s epidemiological transition toward increased non-communicable disease burden. The development of population-specific growth charts for BSSI facilitates early detection of abnormal adiposity patterns, enabling timely intervention. The identified socioeconomic disparities underscore the need for targeted strategies that address social determinants of health, including improving access to nutritious foods, promoting physical activity, and fostering health literacy among vulnerable groups.
The study advocates for integrating advanced anthropometric indices like BSSI into routine clinical and public health surveillance systems. Such indices offer a more nuanced assessment of body morphology than traditional measures like BMI, especially in diverse ethnic populations where fat distribution patterns differ. Policymakers should prioritise culturally tailored health education campaigns, emphasising the importance of maintaining healthy body composition across life stages. Additionally, the models presented herein can inform the design of community-based screening programs and intervention trials, with an emphasis on high-risk groups identified through percentile stratification.
The incorporation of dynamic physiological modeling emphasizes that behavioural modifications—dietary regulation and physical activity—are potent tools in modifying adiposity trajectories. Public health initiatives should, therefore, adopt a multifaceted approach combining behavioural interventions, socioeconomic reforms, and environmental modifications to combat obesity effectively. Given the rising prevalence of obesity and its associated metabolic complications, these strategies are vital for reducing the future burden of diabetes, cardiovascular diseases, and other obesity-related morbidities in Pakistan.
Future directions and recommendations
While this study provides a foundational framework for obesity surveillance using BSSI and advanced statistical methods, further research is warranted to expand its scope. Longitudinal cohort studies are essential to establish causal relationships and temporal patterns of adiposity changes. Inclusion of biochemical parameters such as lipid profiles, blood glucose levels, and inflammatory markers would enrich the understanding of the metabolic consequences associated with BSSI variations. Moreover, exploring gene-environment interactions, particularly genetic predispositions influencing fat distribution, could facilitate personalised risk stratification. Future research should explore the applicability of these models across different regions and ethnic groups within Pakistan, considering the country’s demographic diversity. The integration of digital health technologies, such as mobile health applications and wearable devices, could facilitate real-time monitoring of body composition and lifestyle behaviours, thereby enhancing intervention efficacy. Public health policies should also focus on longitudinal monitoring systems that track BSSI and related indices, enabling dynamic assessment of intervention impacts.
The present work underscores that accurate, population-specific anthropometric standards are indispensable tools in the fight against obesity. The combination of innovative statistical modelling and physiological insights provides a robust platform for early detection, risk assessment, and targeted intervention. The integration of these findings into national health strategies holds promise for mitigating the rising tide of obesity and its associated health consequences in Pakistan and similar low-middle-income settings. This study advances the understanding of adiposity patterns in the Pakistani population through rigorous analytical approaches. The elucidation of nonlinear growth trajectories, socioeconomic influences, and physiological energy dynamics offers a comprehensive perspective on body morphology variations. The validated growth charts and models serve as vital resources for clinicians, researchers, and policymakers committed to combating obesity. Recognising the complex interplay of biological, social, and behavioural factors is essential for designing culturally appropriate, effective public health interventions. These efforts are critical for curbing the escalating burden of obesity and related non-communicable diseases, ultimately fostering healthier populations and reducing healthcare costs in Pakistan and comparable contexts worldwide.
The present study underscores the pivotal role of the Body Shape and Size Index (BSSI) as a robust anthropometric biomarker for obesity surveillance within the Pakistani demographic. Through the application of advanced statistical frameworks, including quantile regression and LMS methodologies, we successfully delineated population-specific growth references that accommodate non-normal, heteroscedastic data distributions characteristic of diverse ethnic cohorts. The findings reveal significant gender dimorphism, with males exhibiting higher BSSI values attributable to differential adipose tissue distribution, notably visceral versus subcutaneous fat depots, which are intricately linked to cardiometabolic risk stratification. The nonlinear association between age and BSSI, characterised by accelerated adiposity during adolescence and middle age, aligns with physiological pubertal hormonal fluxes, metabolic rate fluctuations, and behavioural transitions influencing energy homeostasis. These growth curves serve as critical diagnostic tools for early identification of aberrant adiposity phenotypes, facilitating timely intervention in obesity-related metabolic derangements such as insulin resistance, dyslipidemia, and systemic inflammation.
The integration of dynamic physiological modelling elucidates the intricate energy balance mechanisms underpinning adiposity accrual and depletion, emphasising the bidirectional influence of caloric intake and physical activity on body mass trajectories. The observed socioeconomic disparities highlight the impact of social determinants of health, including nutritional accessibility and sedentary lifestyles, which modulate adiposity profiles and consequent cardio-metabolic morbidity. The congruence between nonparametric and semi-parametric growth standards affirms the methodological robustness and clinical applicability of these models for personalised risk assessment. Collectively, these findings advocate for the incorporation of BSSI-based growth charts into routine clinical assessments and public health surveillance systems, enabling precision medicine approaches for early detection, risk stratification, and targeted management of obesity and its metabolic sequelae in low-middle-income settings like Pakistan.
The authors like to express their sincere gratitude to all the individuals who participated in this study, as well as the organisations and institutions that provided their support and resources. The authors acknowledge the contributions of their colleagues and peers who have inspired and guided them throughout this research journey. The authors extend their appreciation to the reviewers for their valuable feedback, which has significantly improved the quality and clarity of this work.
Funding statement
This research was conducted independently without any external funding. The authors have not received any financial support from any grant, organisation, or institution in relation to this study.
Informed consent/Patient consent: The data have been collected with the respondents’ consent.
Data availability statement: Data will be available upon request.
Author’s contribution
Waqas Ghulam Hussain, Atif Akbar & Muhammad Fareed Sharif conceived, designed and did statistical analysis & editing of the manuscript. Waqas Ghulam Hussain and Farrukh Shehzad did data collection and manuscript writing. Farrukh Shehzad & Atif Akbar did the review and final approval of the manuscript.
- Long L, Hamdani SD, Hamdani SMZH, Zhuang J, Khurram H, Hadier SG. Establishing age- and sex-specific anthropometric growth reference standards for South Punjab adolescents utilising the LMS method: findings from the Pakistani population. Front Public Health. 2024;12:1417284.
- Tanveer M, Hohmann A, Roy N, Zeba A, Tanveer U, Siener M. The current prevalence of underweight, overweight, and obesity associated with demographic factors among Pakistani school-aged children and adolescents—An empirical cross-sectional study. Int J Environ Res Public Health. 2022;19(18):11619.
- Saeed S, Janjua QM, Haseeb A, Khanam R, Durand E, Vaillant E, et al. Rare variant analysis of obesity-associated genes in young adults with severe obesity from a consanguineous population of Pakistan. Diabetes. 2022;71(4):694-705.
- Khan S, Nauman H, Saher S, Imtiaz HA, Bibi A, Sajid H, et al. Gender difference in obesity prevalence among the general population of Lahore, Pakistan. Eur J Med Health Sci. 2021;3(3):55-58.
- Ibrahim S, Akram Z, Noreen A, Baig MT, Sheikh S, Huma A, et al. Overweight and obesity prevalence and predictors in people living in Karachi. J Pharm Res Int. 2021;33:194-202.
- Basit A, Askari S, Zafar J, Riaz M, Fawwad A, NDSP Members. NDSP 06: Prevalence and risk factors for obesity in urban and rural areas of Pakistan: A study from the second National Diabetes Survey of Pakistan (2016–2017). Obes Res Clin Pract. 2021;15(1):19-25.
- Sharif H, Sheikh SS, Seemi T, Naeem H, Khan U, Jan SS. Metabolic syndrome and obesity among marginalised school-going adolescents in Karachi, Pakistan: a cross-sectional study. Lancet Reg Health Southeast Asia. 2024;21.
- Kuang M, Sheng G, Hu C, Lu S, Peng N, Zou Y. The value of combining simple anthropometric obesity parameters, body mass index and a body shape index, to assess the risk of non-alcoholic fatty liver disease. Lipids Health Dis. 2022;21(1):104.
- Spinelli A, Buoncristiano M, Nardone P, Starc G, Hejgaard T, Júlíusson PB, et al. Thinness, overweight, and obesity in 6- to 9-year-old children from 36 countries: the WHO European Childhood Obesity Surveillance Initiative—COSI 2015–2017. Obes Rev. 2021;22:e13214.
- Mohajan D, Mohajan HK. Body mass index (BMI) is a popular anthropometric tool to measure obesity among adults. J Innov Med Res. 2023;2(4):25-33.
- Breda J, McColl K, Buoncristiano M, Williams J, Abdrakhmanova S, Abdurrahmonova Z, et al. Methodology and implementation of the WHO European Childhood Obesity Surveillance Initiative (COSI). Obes Rev. 2021;22:e13215.
- Hussain WG, Akbar A, Shehzad F. Gaussian (Z-score) percentiles of ponderal index (PI) in Pakistani children and adults: a quantitative approach to human growth analysis. MOJ Gerontol Geriatr. 2024;9(3).
- Hussain WG, Shehzad F, Akbar A. A comparative assessment of body shape and size index (BSSI), body mass index (BMI), and body surface area (BSA) in predicting diabetes prevalence among Pakistani adults. Int J Clin Med Surg. 2025;2(1):1-11.
- Hussain WG, Shehzad F, Ahmad R, Akbar A. Establishing growth charts for the proposed body shape and size index of the Pakistani population using a quantile regression approach. SAGE Open Med. 2021;9:20503121211036135.
- Hussain WG, Shehzad F, Akbar A. Comparison of quantile regression and Gaussian (Z-scores) percentiles to BSA in growth charts with a Pakistani population. Gerontol Geriatr Med. 2024;10:23337214241273189.
- Shehzad F, Hussain WG, Akbar A. A comparative evaluation of quantile regression percentiles, Gaussian percentiles, and raw percentiles to body shape and size index (BSSI) in growth charts: A case study of Pakistan. Open Access J Surg. 2024;16(2).
- Qureshi MA, Hussain WG. Assessment of body shape and size index (BSSI) in relation to Gaussian percentiles growth charts: a gender-specific analysis across age cohorts in South Punjab, Pakistan. Curr Res Diabetes Obes J. 2025;17(5).
- Hussain WG, Shehzad F, Akbar A. Comparison of nonparametric quantile regression and semi-parametric LMS to body mass in growth charts with a Pakistani population. Acad J Ped Neonatol. 2025;15(1).
- Aisha R, Akbar A, Hussain WG. Effect of pre-delivery body mass index and gestational weight gain on infant weight. Int J Biosci. 2019;15(5):218-226.
- Hussain WG, Shehzad F, Akbar A. Examining the relationship between obesity and income distribution using body mass index (BMI) and body shape and size index (BSSI): a case study of Pakistan. Gerontol Geriatr Med. 2024;10:23337214241288795.
- Hussain WG. A new standard for mortality prediction: the body shape and size index (BSSI) emerges as a superior alternative. Open Access J Surg. 2025;16(3).
- Hussain WG. From data to insights: analyzing body shape and size index (BSSI) trends in Pakistani population through growth charts of Gaussian (Z-scores) percentiles. J Community Med Public Health. 2025;9:516.
- Atique H, Hussain WG. Quantile regression analysis for examining gender variations in obesity prevalence in Pakistan using body surface area percentiles in growth charts. Curr Res Diabetes Obes J. 2024;17(5).
- Hussain WG, Qureshi MA. A comprehensive review of body shape and size index (BSSI) in relation to obesity: insights from recent studies in Pakistan. J Gynecol Obstet Mother Health. 2025;3(2):1-10.
- Qaisar R, Karim A. BMI status relative to international and national growth references among Pakistani school-age girls. BMC Pediatr. 2021;21:1-12.
- Asif M, Aslam M, Mazhar I, Ali H, Ismail T, Matłosz P, et al. Establishing height-for-age Z-score growth reference curves and stunting prevalence in children and adolescents in Pakistan. Int J Environ Res Public Health. 2022;19(19):12630.
- Kiran A, Shah NA, Khan SM, Ahmed H, Kamran M, Yousafzai BK, et al. Assessment of knowledge, attitude, and practices regarding the relationship of obesity with diabetes among the general community of Pakistan. Heliyon. 2024;10(8).
- Koenker R, Hallock KF. Quantile regression. J Econ Perspect. 2001;15(4):143-156.
- Mokalla TR, Rao Mendu VV. Application of quantile regression to examine changes in the distribution of height-for-age (HAZ) of Indian children aged 0–36 months using four rounds of NFHS data. PLoS One. 2022;17(5):e0265877.
- Zhang W, He Y, Yang S. Day-ahead load probability density forecasting using a monotone composite quantile regression neural network and kernel density estimation. Electr Power Syst Res. 2021;201:107551.
- Asif M, Aslam M, Khan S, Altaf S, Ahmad S, Qasim M, et al. Developing neck circumference growth reference charts for Pakistani children and adolescents using the lambda–mu–sigma and quantile regression method. Public Health Nutr. 2021;24(17):5641-5649.
- Cordeiro GM, Rodrigues GM, Prataviera F, Ortega EM. A new quantile regression model with application to human development index. Comput Stat. 2024;39(6):2925-2948.
- Pereira S, Bastos F, Santos C, Maia J, Tani G, Robinson LE, et al. Variation and predictors of gross motor coordination development in Azorean children: a quantile regression approach. Int J Environ Res Public Health. 2022;19(9):5417.
- Worldometers. Pakistan population [Internet]. 2023 [cited 2024 Apr 27]. Available from: https://www.worldometers.info/world-population/pakistan-population/?form=MG0AV3
- UNFPA Pakistan. Pakistan: walking the talk on population and reproductive rights [Internet]. 2026 [cited 2026]. Available from: https://pakistan.unfpa.org/en/news/pakistan-2026-walking-talk-population-and-reproductive-rights
- Omair A. Sample size estimation and sampling techniques for selecting a representative sample. J Health Spec. 2025;2(4):142.
- Fassett KT, Wolcott MD, Harpe SE, McLaughlin JE. Considerations for writing and including demographic variables in education research. Curr Pharm Teach Learn. 2022;14(8):1068-1078.
- Dahal N, Neupane BP, Pant BP, Dhakal RK, Giri DR, Ghimire PR, et al. Participant selection procedures in qualitative research: experiences and some points for consideration. Front Res Metrics Anal. 2024;9:1512747.
- Kang H. Sample size determination and power analysis using the G*Power software. J Educ Eval Health Prof. 2021;18.
- Mazhar SA, Anjum R, Anwar AI, Khan AA. Methods of data collection: a fundamental tool of research. J Integr Community Health. 2021;10(1):6-10.
- Rumbo-Rodríguez L, Sánchez-SanSegundo M, Ferrer-Cascales R, García-D’Urso N, Hurtado-Sánchez JA, Zaragoza-Martí A. Comparison of body scanner and manual anthropometric measurements of body shape: a systematic review. Int J Environ Res Public Health. 2021;18(12):6213.
- Fernandes Santos Alves R, de Moraes Mello Boccolini P, Baroni LR, de Almeida Relvas-Brandt L, de Abreu Junqueira Gritz R, Siqueira Boccolini C. Brazilian spatial, demographic, and socioeconomic data from 1996 to 2020. BMC Res Notes. 2022;15(1):159.
- Sanders Thompson VL, Ackermann N, Bauer KL, Bowen DJ, Goodman MS. Strategies of community engagement in research: definitions and classifications. Transl Behav Med. 2021;11(2):441-451.
- Patel K. Quality assurance in the age of data analytics: innovations and challenges. Int J Creat Res Thoughts. 2021;9(12):f573-f578.
- Sarvi F, Heuss M, Aliannejadi M, Schelter S, de Rijke M. Understanding and mitigating the effect of outliers in fair ranking. In: Proceedings of the Fifteenth ACM International Conference on Web Search and Data Mining. 2022. p. 861-869.
- Peng L. Quantile regression for survival data. Annu Rev Stat Appl. 2021;8(1):413-437.
- Zwillinger D, Dobrushkin V. Handbook of differential equations. Boca Raton (FL): Chapman and Hall/CRC; 2021.
- Alexandrou C. MINISTOP 2.0: a smartphone app integrated in primary child health care to promote healthy diet and physical activity behaviours and prevent obesity in preschool-aged children [dissertation]. Linköping (Sweden): Linköping University; 2023.
- Waltsgott L, Adedeji A, Buchcik J. Ideal body image and socioeconomic factors: exploring the perceptions of Kenyan women. BMC Womens Health. 2024;24(1):501.
- Muscogiuri G, Verde L, Vetrani C, Barrea L, Savastano S, Colao A. Obesity: a gender-view. J Endocrinol Invest. 2024;47(2):299-306.
- Cooper AJ, Gupta SR, Moustafa AF, Chao AM. Sex/gender differences in obesity prevalence, comorbidities, and treatment. Curr Obes Rep. 2021;10:1-9.
- Argyrakopoulou G, Dalamaga M, Spyrou N, Kokkinos A. Gender differences in obesity-related cancers. Curr Obes Rep. 2021;10:100-115.
- Pesch MH, Lumeng JC. Early childhood obesity: a developmental perspective. Annu Rev Dev Psychol. 2021;3:207-228.
- Ludwig DS, Aronne LJ, Astrup A, de Cabo R, Cantley LC, Friedman MI, et al. The carbohydrate-insulin model: a physiological perspective on the obesity pandemic. Am J Clin Nutr. 2021;114(6):1873-1885.
- Calcaterra V, Vandoni M, Rossi V, Berardo C, Grazi R, Cordaro E, et al. Use of physical activity and exercise to reduce inflammation in children and adolescents with obesity. Int J Environ Res Public Health. 2022;19(11):6908.