
More Information
Submitted: November 18, 2022 | Approved: November 24, 2022 | Published: November 25, 2022
How to cite this article: Drouet N, Bassement J, Barbier F. The modified star excursion balance test for the detection of the risk of injury in elite handball female players. J Sports Med Ther. 2022; 7: 019-027.
DOI: 10.29328/journal.jsmt.1001059
Copyright License: © 2022 Drouet N, et al. This is an open access article distributed under the Creative Commons Attribution License, which permits unrestricted use, distribution, and reproduction in any medium, provided the original work is properly cited.
Keywords: Prevention of injury; mSEBT; Composite score; Follow-up

The modified star excursion balance test for the detection of the risk of injury in elite handball female players
Noémie Drouet1, Jennifer Bassement2* and Franck Barbier3
1Polytechnic University of Hauts de France, Valenciennes, France
2Jean Stablinski Rehabilitation Institute, Valenciennes Hospital Centre, Valenciennes, France
3LAMIH - Laboratoire d’Automatique, de Mécanique et d’Informatique Industrielles et Humaines - UMR 8201, Valenciennes, France
*Address for Correspondence: Jennifer Bassement, Jean Stablinski Rehabilitation Institute, Valenciennes Hospital Centre, Valenciennes, France, Email: [email protected]
Background: Elite handball female players are at high risk of injury to the lower limbs. The modified Star Excursion Balance Test (mSEBT) is efficient in detecting players with a risk of injury. However, performed once before the season, the mSEBT cannot determine with precision when the injury will occur.
Purpose: The objective of the study was to investigate if a repeated measure of mSEBT across the season would help in identifying with precision the period at risk of injury for each player.
Methods: Eleven elite female handball players took part in the study. The mSEBT was measured weekly for 25 weeks and the injuries were recorded. Composite Scores (CS) and distances on each axis were computed for both legs of each player. The 94% cut-off on the composite score and the 4 cm difference between the right and left leg on the anteroposterior axis (ANT) was investigated for each player.
Results: Five players reported injury. The 94% cut-off on the CS and the 4 cm difference on ANT were not significant indicators of risk of injury in our study. However, for each injured player, a drop in the composite score was noticed the week before the injury.
Conclusion: We propose the drop of CS as an indicator for the detection of the risk of injury in a follow-up of elite athletes using repeated mSEBT. This indicator allows the detection of injury a week before it occurs. Further work is needed to confirm, investigate and validate this indicator.
Handball is among the team sports counting the more participants in the world. This is a sport with high-velocity plays, it includes jumps, direction changes and one on one contests all game long [1-3]. Handball is considered as a sport with a high risk of injuries [4,5]. Several studies have looked at the occurrence of injuries in handball and showed a higher rate of injury for women compared to men. In 1997, women’s handball players were already more prone to Anterior Cruciate Ligament (ACL) injury compared to men’s handball players [4]. Langevoort, et al. [6] recorded the injuries during six international handball events. They measured a rate of 108 injuries for 1000 game hours with a larger interval of injuries for women 84-145/1000 compared to men 89-129/1000. The study of Aman, et al. [2] proposed an interesting count of injuries in sports, the authors analyzed the data from the health insurance system in Sweden and looked at the injuries reported in 35 sports. Handball is the sport reporting the second highest risk of injury just after motorsports with an occurrence of 63.4 injuries on 1000 athletes. In handball, the study showed a higher rate of injury for women (71,1/1000 athletes) compared to men (57.2/1000 athletes). Similar observations were made in the study of Laver, et al. [7], they reported the number of injuries in handball in several international events. For example, they looked at the 2012 Olympic Games, forty-five injuries occurred on 171 female handball players with 5.8% of injuries requesting more than 7 days of rest while only 31 injuries occurred on male players (178) with a lower amount of injury (3.4%) requesting similar resting period. During the 2010 European Handball championship, a study reported the number and type of injuries recorded during the 47 games. Eighty-five injuries occurred including 46 contusions, 15 sprains and 10 muscle or tendon ruptures [8]. It represents 1.8 injuries per game on average with 21% of the injury located in the lower limbs.
Sports injuries have impacts at different levels: On the player individually, on the team, and on the sports organization with important financial aspects for professional organizations [9]. The study of Dauty-Louvet, et al. [10] measured that after four weeks of immobilization, cyclist athletes are already loosing skills, decreasing neural activity, reducing cardiovascular capacity, and diminishing power and strength. They also observed an expanded recovery time when the sport requests fine motor skills and a precise technical level. Vigelso, et al. [11] have also reported the loss of strength and mass in the leg muscles after 2 weeks of immobilization. Most importantly, they reported a six-week rehabilitation exercise training not being sufficient to regain similar muscle performances as before the immobilization.
Reducing the occurrence of injury seems therefore essential to limit the negative impacts. The literature agrees on the strategy to reduce injury: it requests the identification of the context, causes and risks leading to injury [9,12-14].
The authors proposed guidelines to limit injuries: the recommendations include using adapted and specific training tools, setting up a specific program for the reduction of injuries [13,15] and building up a collaboration between the coach and the medical staff [16].
To apply such recommendations, the authors suggested performing pre-season testing to detect the athletes at risk of injury and proposed the modified Star Excursion Balance Test (mSEBT). This test requests to stand on one foot and move the free foot to reach the farthest distances in different directions. It has been widely accepted to detect imbalance and instability of lower limbs and therefore identify an increased risk of injury [17-19].
To our knowledge, the studies published until now and using the mSEBT are all performing the testing in once pre-season. The results from those studies, confirm the capacity of the test to detect the risk of injury of the players in the upcoming season. Indeed the players reporting injury during the season presented an altered performance at the mSEBT [17,18,20-23].
In our study, we are willing to sharpen the detection of the risk of injury. A pre-season mSEBT is efficient in detecting players at risk of injury but does not provide precision about when the injury may occur: in days? weeks? months? We hypothesize that a repeated mSEBT across the season will help to refine the period of the risk of injury in a population of elite female handball players.
Population
The study was led from September 2018 to March 2019 (the study ended with the COVID confinement) and included 13 female handball players from the 2nd division of the national league of France. The club acceded to the 1st division at the end of the study. The average age was 25 years (min: 19y, max: 30y, SD: 3.91y), the average height was 175 cm (min: 165 cm, max: 188 cm, SD: 0.07 cm), the average weight was 71.78 kg (min: 58 kg, max: 87 kg, SD: 8.08 kg) and the average BMI (Body Mass Index) was 23.29 (min: 21.3, max: 25.95, SD: 1.35). The players were all right-handed with a dominant left foot because the dominant leg and dominant hand are opposed in handball. All the players are left dominant foot thereby we describe the side as right and left foot instead of the dominant and non-dominant foot throughout the study. All the players reported at least one history of injury at the ankle in the past 2 years with an average of 2 ankle injuries per player (min: 1, max: 5, SD: 1.5). They also reported a total of 8 injuries at knee level and 2 at shoulder level.
Table 1 presents all the players with anthropometric data, the participation in the tests throughout the study, and the occurrence of injury.
The players were randomly identified as P1 to P13. The results for P2, P4 and P13 are incomplete due to sickness, ACL (Anterior cruciate ligament) injury and late inclusion due to return from ACL injury respectively. Two players were excluded P7 and P8 asked to be removed from the study. Therefore, 11 players remained in the study.
The study was performed following the latest amendment of the declaration of Helsinki. All participants read the information sheet and signed a consent form.
The test used was the modified Star Excursion Balance Test (mSEBT) which has been validated by Robinson and Gribble [24] it has high inter and intra-reproducibility [25]. The modified test is quicker and has already been found to be efficient in preventing ankle injury in basketball and handball [17,18,20]. Figure 1 illustrates the mSEBT with the 3 axes: anterial axis (ANT), posteromedial axis (PM) and postero-lateral axis (PL).
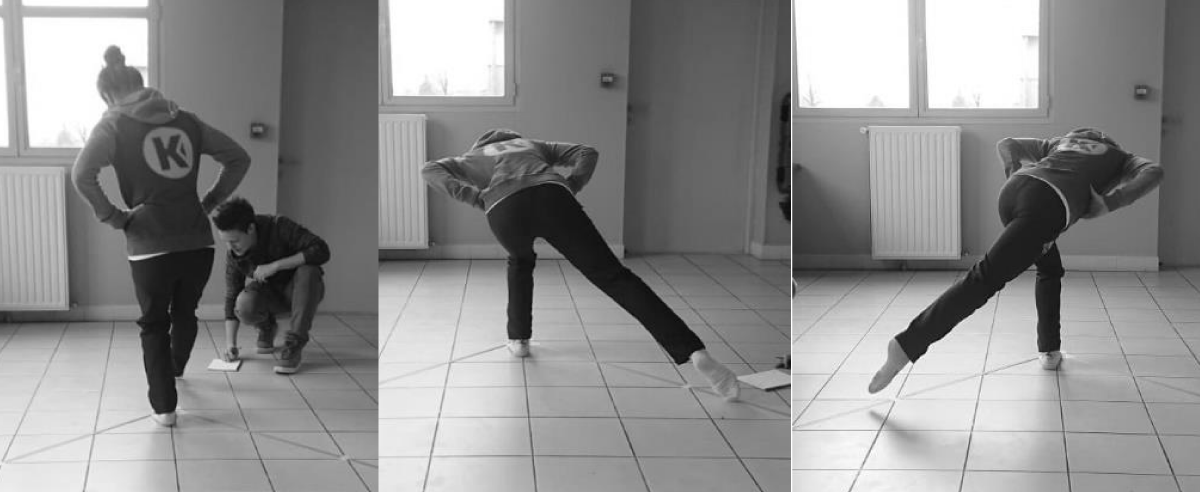
Figure 1: Representation of the performance at the mSEBT.
The axes were drawn using measuring tapes fixed on the ground for quick measurement. The precision is estimated at 0.5 cm [26]. The tests were performed each Wednesday between 11 am and 12 pm to avoid any variability due to the time of the day or the moment of the week [27]. The tests were performed according to the recommendations of Picot, et al. [28]:
− The participant is standing on one foot and has to reach with the free foot the farther distance possible on each axis.
− Four warming-up trials and 3 measurements on each axis by alternating right and left leg.
− The hands were kept on the hips, the participant were bare feet (or in socks) and the big toe was placed on the intersection of the 3 axes.
− The distance between the iliac anterosuperior spine and the ankle medial malleolus was used to normalize the data and combine the composite scores.
− The test failed when the participant touch the ground with the free foot before reaching the maximal distance when the weight is transferred on the free foot when the standing foot moved, when the heel of the standing foot is lifted or when the hands are leaving the hips.
Additional tests and questionnaires: At the beginning of the season, all the players performed medical pre-season testing including muscle strength, muscle power, and range of motion, but the data were not released to the coach nor the staff and we therefore could not use the data. Daily questionnaires were also requested from the players for the collection of subjective data such as sleep quality, fatigue, wellness, nutrition and menstrual phases. However, the players did not consistently reply to the questionnaires consequently the data were incomplete. The irregularity of the subjective data prevents conducting a proper analysis. Even if the medical data and the subjective data would have brought great value to this study, it was not possible to use them in this current analysis.
Data collection
During the 25 weeks of data collection, the tests were performed once a week. Upon the request of the coach, there was no testing on game days, during rest weeks, and during the winter truce. During the 25 weeks of the study, the measurement was made for 18 weeks (Table 1). On the 11 players, 160 tests were performed with an average of 14.5 tests per person (min: 5, max: 18, SD: 4.10). Except for P2 and P4 who could not continue the testing due to sickness and injury (as mentioned earlier), the rest of the players performed a minimum of 14 tests. A total of 2880 measurements were collected. The occurrence of lower limb injury was recorded throughout the season.
Analysis
Normalized distances and composite scores were computed according to the recommendation of Picot [28]. The mSEBT distances were standardized to the length of the leg, the scores are then expressed as a percentage of the leg length as explained in the following equation.
The Composite Score (CS) is then computed for each leg with the following equation: (ANT PM and PL being the three axes as defined earlier).
Plisky, et al. [17] defined a cut-off value at 94% of the composite score. In this study, we count the number of values under the cut-off score for each player.
Statistics
The tests are repeated measurements over time on the same population: t-test analysis was performed to detect significant differences between legs for each player. The values analyzed through the t-test were the distances on each axis of each leg and the composite scores of each leg.
The Bravais-Pearson correlation coefficients were computed for each player on all values measured: ANT right, ANT left, PL right, PL left, PM right, PM left, Composite Score right and Composite Score left.
The variations of the Composite Scores through time were measured for the whole group. The positive values represent an increase in the CS and the negative values represent a drop in the CS. The frequency and distribution of those values were then analyzed.
Injuries
Five players reported injuries during the season of the study. P3 reported a left sprained ankle twice in the same week (week 12) but with no reported pain and no consequences to the participation in training and games. P4 reported a right ACL injury at week 12, this injury ended her season. P9 reported right calf muscle twitching in week 12 that requested 1 week of rest. P10 reported a left plantar fascia injury at the end of the season outside of the period of testing. P12 reported a right ankle injury in week 8 but did not stop for recovery and continued training and playing games. She had continuous pain throughout the season and reported a hamstring injury in week 24. Table 1 shows a visualization of the injuries within the testing period.
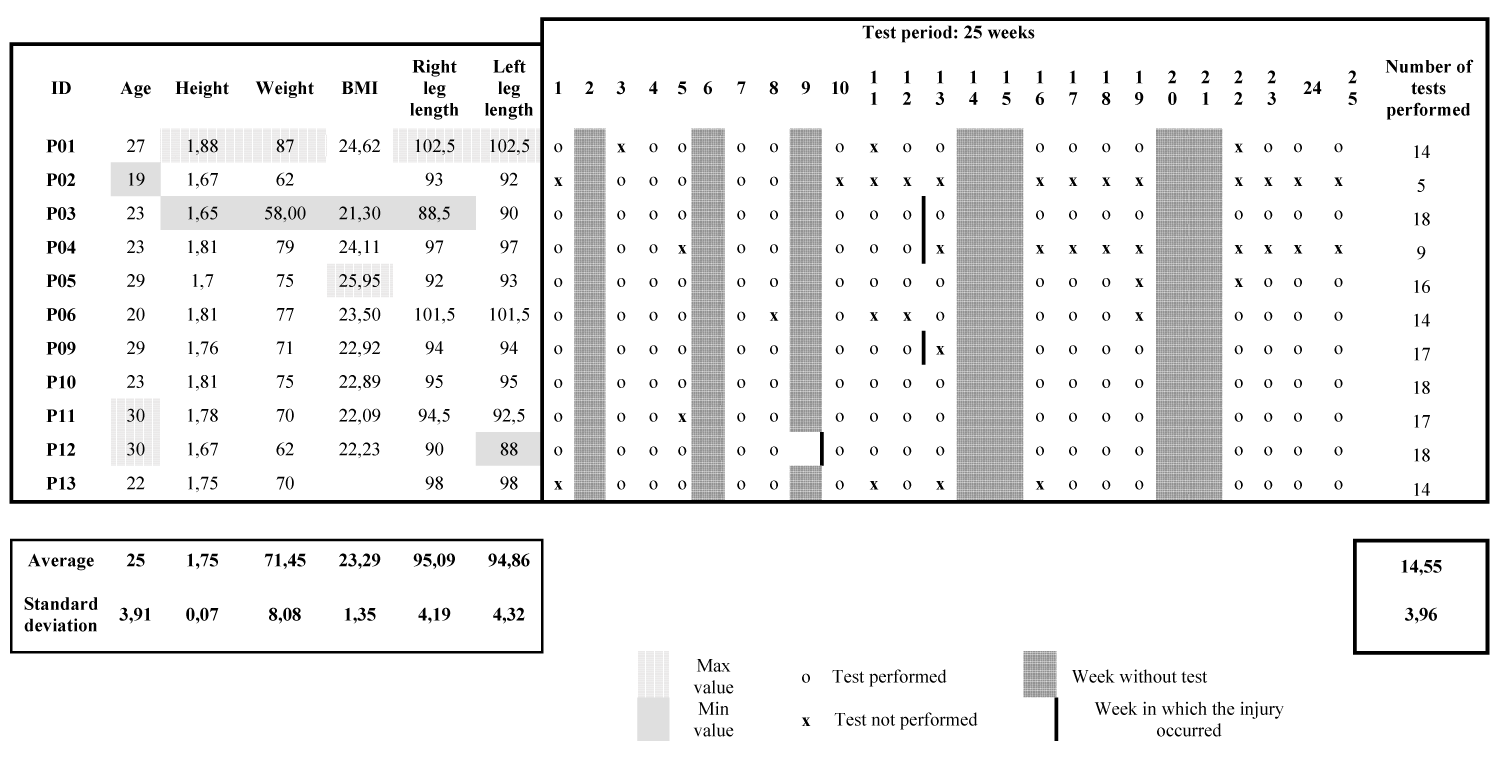
Table 1: Anthropometric data of all the players, participation in the testing session and occurrence of injury.
From now on, in the paper, the injured players are written with a “#” to help read the results and remember which players were injured. Therefore, the injured players are from this line mentioned as P3#, P4#, P9#, P10# & P12#.
94% cut off
Of the 320 composite scores computed, 132 are under 94% which represents 41.25% of the measurements. Table 2 presents the composite scores for all the players for the right leg and the left leg, the average composite score for each leg and each player is displayed, the score under the cut-off are flagged (see the legend of the Table) and the count and percentage of scores under the cut off value are reported. The percentage of scores under the cut-off value was under 10% for three players (P2, P10# & P11), between 20% and 30% for 2 players (P9# & P12#), between 30% and 40% for 2 players (P4# & P13), 50% for one player (P3#) and over 70% for three players (P1, P5 & P6). The players P12# and P13 showed much more scores under the cut-off value on the left side (38.9% and 42.9% respectively) compared to the right side (16.7% and 28.6% respectively). Player P3# showed a higher number of scores under the cut-off value in the first part of the season (the 9th first tests on the 18th tests had scores under the cut-off value).
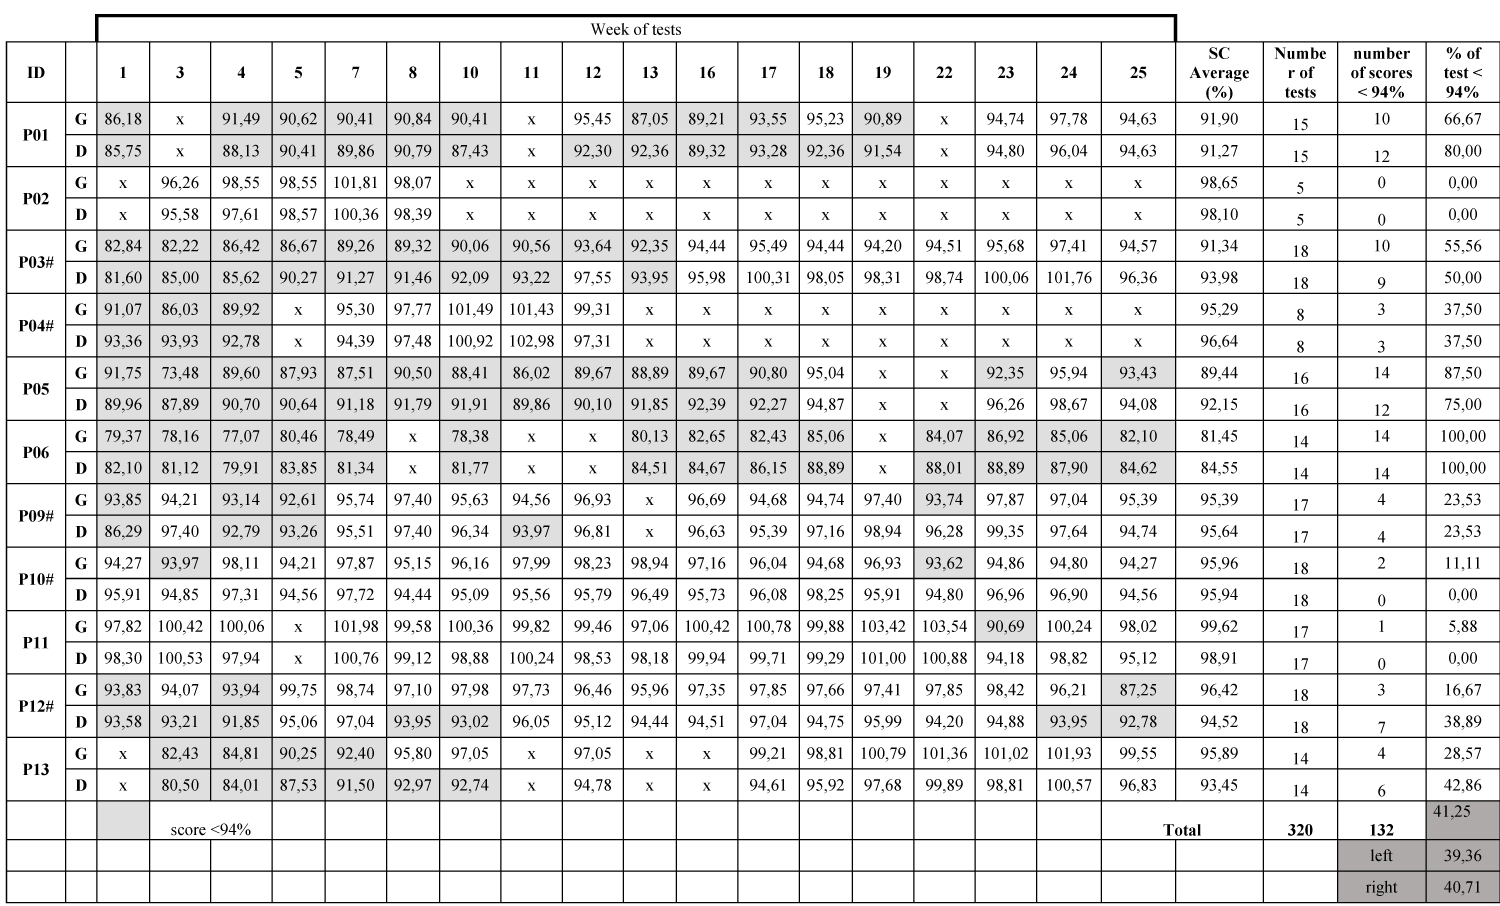
Table 2: Composite scores for all the players on both legs, average CS, number, and percentage of the score under the cut-off value.
Result of the t-test
− t-test composite score
The t-tests established significant differences between legs on the CS for P3#, P5, P6, P12#, and P13.
− t-test distance ANT – PM- PL
The t-tests established significant differences between legs on the ANT axis for P3#, P6, P9#, P10#, P11, P12#, and P13. The t-tests established significant differences between legs on the PM axis for P3#, P5, P6, P10#, P12#, and P13. The t-tests established significant differences between legs on the PL axis for P1, P2, P3#, P6, P9#, P10#, and P11.
Plisky’s indicator of 4 cm on the ANT axis
Plisky, et al. [17] used the indicator of a 4 cm difference between the right and left leg on the ANT axis to predict a higher risk of injury. We looked at this indicator in our study. Three players (P2, P9# & P11) showed no differences between legs on the ANT axis. Five of the players (P1, P3#, P5, P6 & P13) presented only one test with at least a 4 cm difference between the legs on the ANT axis and two players (P4# & P12#) showed two and three tests respectively with this difference. Only one player (P10#) showed half of the tests presenting at least a 4 cm difference between the legs on the ANT axis.
Results of the Bravais-Pearson‘s correlation
The strength of the correlations was very variable according to players and values compared. For example, P3# and P13 presented strong correlations for all the values while P1 and P10# presented weak correlations for most of the values compared. The analysis did not find a strong correlation between any value that was consistent across all players even when looking at the injured players and the injured leg. For example, P3# was injured on the left leg, and all the values of the left CS were strongly correlated with all the other values, but P12# who was injured on the right leg show weak correlations between the right CS and all the other values.
Follow-up results for CS and distances
During the four first weeks of the testing, all but 2 players presented an increase in the composite scores of both legs before reaching a plateau. On average, the scores increase by 3.63% (min: 0.35, max: 7.82, SD: 2.28) on the left side and 4.13% (min: 1.40, max: 8.66, SD: 2.63) on the right side. The two players with no increase in the first 4 weeks were P4# and P5.
The injured players presented a drop in the CS the week before the injury on the leg suffering the injury. For the player P3#, the CS drops from 93.64% to 92.35% on the left side (-1.38%). For player P4#, the score drops from 102.98% to 97.31% on the right leg (-5.51%). For P9#, the CS drops from 96.34% to 93.97% on the right leg (-2.45%). P10# suffered an injury at the end of the season while the data collection was over but we looked at the drop before she started feeling pain in the tendon (which was the area of injury). The CS drops from 96.04% to 94.68% on the left side (1.42%). For the P12#, the CS drops from 97.04% to 93.95% on the right leg before the first injury and from 98.42% to 96.21% on the left leg before the second injury.
The graph representing the frequency of occurrence of the variations of the CS shows a normal distribution. Figure 2 represents the distribution of the frequency of occurrence of CS variation for the whole group of participants. The Figure 2 shows that the majority of the CS is between a negative variation of 2 points and a positive variation of 3 points. Seventy-five percent (75.17%) of the CS are included in that [-2: +3] range. Seven percent (7.38%) of the CS present a negative variation of at least 2 points (range [-12: -2]).
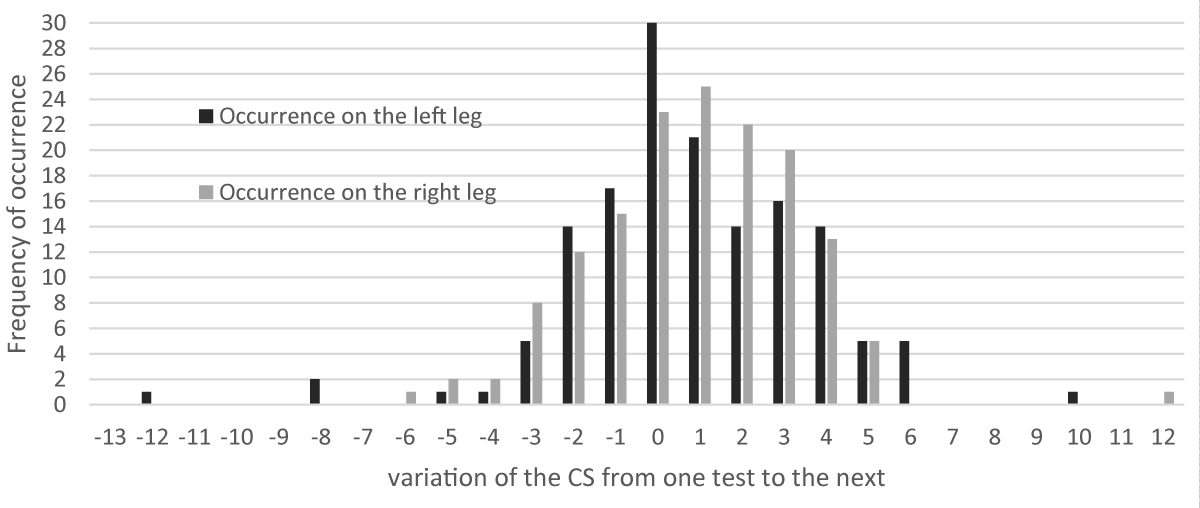
Figure 2: Distribution of the frequency of occurrence of the variations of the CS for the whole group on the left and right leg.
The mSEBT has been used in various sports to measure the dynamic balance before the sports season and to assess ankle instability and risk of injury [17,20,29].
The studies measuring mSEBT are using different cut off on the composite score to discriminate the risk of injury. The most commonly used and reported cut-off is 94% and was set by Plisky, et al. [17]. In their study, the women basketball players with CS under 94% had 6.5 more risks of getting injured compared to the players above the cut-off. The authors proposed to set a specific cut-off per sport. Following this advice, Butler, et al. [30] set a cut-off for American football players at 89.6%, they showed that players with a score below this cut-off are 3.5 times more likely to get injured. The recent study by Udompanich and al. [23] set up a cut-off score of 91% but did not specify the sport of the participants, only that they were recruited from university clubs. The players with less than 91% CS score had severe balance impairment and were more likely to be at risk of lower extremity reinjury. The test of mSEBT in Handball was performed by Picot, et al. [31] and they found a similar cut-off as Plisky: they set the cut-off at 94.1% in female players.
In our study, each player had multiple tests and therefore we looked at the numbers of the score under the cut-off value. The players with a large number of results under 94% did not suffer from injury: for example, P6 recorded all the scores under the 94% cut-off, did not suffer injury but only ankle instability. Similarly, P1 and P5 presented respectively 92% and 80% of their CS under the cut-off value but never reported injury. On the contrary, P4#, P10#, and P12# reported injuries despite the very low number of SC under the cut-off value: 0%, 5.5%, and 22% respectively. If we look at the other cut-off set by others studies at 89.6 and 91%, we reach the same results. For example, P6 was the only player under those cut-offs but was not injured while other players such as P4# presented results over those cut-offs (about 95%) and were badly injured. One player presented specific results: P6 had low CS and did not get injured but reported ankle instability. It seems possible that her results detect the instability rather than an injury especially since she has an history of ankle injuries. A previous study showed that a group of healthy participants with an history of injury presented lower CS than a group of healthy participants with no history of injury [20]. However, in our study, all the players reported an history of an ankle injury, therefore the decreased CS for P6 cannot be only due to injury history. Another factor for decreased CS could be a limited range of motion at the ankle, indeed, Hoch, et al. [32] demonstrated that a lower range of motion at the ankle decreases the performance measured on the ANT axis. Unfortunately, in our study, the range of motion measurements was collected by the medical staff but we never get access to the data, we should have considered measuring the range of motion using the weight-bearing lunge test [32]. Visually, P6 struggled with a maximum range of motion at the ankle but we have no data confirming this.
In our study with female Handball players, no cut-off could be found. Our study does not confirm the findings of the previous study in the use of a cut-off to detect the risk of injury.
There are major differences in our study compared to the previous studies [17,23,28,30] using cut-off. The study of Plisky, et al. [17] used the maximum distances on each axis while we used the average value over the three tests, as did Udompanich, et al. [23] and Picot, et al. [31]. Several studies agree that the maximal score is reached after four trials on each axis and each leg [18,33,34]. The good reproducibility of the test allows choosing either the average or the maximum data as long as the warm-up imposes 4 trials. We chose to use the average distance out of the three trials to avoid the extreme values that we noticed in our data collection. The extreme value noticed in our study could be explained by the highly competitive attitude of our players always willing to improve their scores or to beat the score of their teammates. We recruited only elite players so did Picot, et al. [31] but Plisky [17] and Udompanich [23] included high school basketball players and amateur university sports practitioners respectively. The elite players are a specific population with a high load of training and a higher risk of injury [35]. The results at mSEBT score differ between elite players and amateur or young players [22].
The number of participants was much higher in the three studies establishing cut-offs compared to ours. We recruited 13 players and had to exclude two while the other studies recruited 235 basketball players, 54 university players, and 188 handball players. Those studies performed a single test and therefore could include a large number of participants, in our study we performed 18 tests for each player, and the time necessary for each player was therefore multiplied by 18 compared to the studies cited. Other studies measuring performances at the mSEBT recruited a similar number of participants as our study: 16 participants for Hertel, et al. [36], 15 for Lim, et al. [37], and 13 for Horsak et al. [38]. All of them performed additional measurements to the mSEBT and therefore the time necessary for measurement increases with the number of participants. Hertel, et al. [36] measured inter and intra-reliability of the test and therefore performed multiples testing, Lim et al. [37] measured mSEBT and One leg stance test in three conditions and Horsak, et al. [38] added 3D analysis to the mSEBT. Our number of participants seems therefore consistent with the literature for multiple testing.
We used the mSEBT such did Plisky, et al. [17] and Picot, et al. [31] however, Udompanich, et al. [23] used a Y Balance Test (YBT) which is an instrumented mSEBT. The YBT is performed the same way as the mSEBT but the distance on each axis is determined by moving a cursor with the toes of the free foot. The literature cited and used both tests without differentiation, there are both validated for the detection of injury risk but the measurement being slightly different, the results cannot be compared directly [26,33,39].
The studies previously cited [17,22,23,28] used a single mSEBT test while we performed a repeated test across the season (18 tests). Our tests were performed on the same day at the same time each week and therefore canceled all the biases due to the context of the training or the participant life [27]. In our study, the repeated measurements showed a learning effect of the mSEBT test. During the 4th first week of the follow-up, nine out of the eleven players increased their score by about 4%. Two players did not increase their score in the first four weeks of the study: P4# which is probably because she already reported pain at that time and P5 but we have no explanation for this player. Player P7 presented an increase of over 7% for each leg, this important improvement can be explained by the fact she was returning from injury and therefore was slowly recovering strength and proprioception. A learning effect on mSEBT has been noticed by Hertel, et al. [36] when repeating the test over a week but to our knowledge, no study has looked at a repeated measurement over months. The mSEBT is dependent on the strength of the legs [40], therefore when the players train and gain strength the mSEBT would improve. In our study, the players had started the training over a month before the beginning of the data collection, therefore there is very little chance that the improvement was due to a sudden gain of strength for all the players (except for P7 as mentioned earlier who was returning from injury). It suggests that the results of the 4th first weeks should not be taken into account when assessing the dynamic balance using the mSEBT, we should rather use the score when the plateau is reached. It could also explain why our results differ from the literature where the authors used a single mSEBT and therefore are recording scores that would probably change over the first 4 weeks.
In our study, we compared the distances on each axis between legs and the composite scores of each leg using a t-test. We also measured the correlation between all scores for each player. No meaningful results came out of the analysis. The differences reported concerned injured as well as non-injured players and therefore are not discriminant for the detection of the risk of injury. Very few studies have used t-tests and correlations to compare scores and legs and when they do, they performed the t-test and correlation on the average value of the group while we compare each player to herself. No asymmetry was found in the study of Onofrei, et al. [41] with elite soccer players, nor with adolescent female footballers [42]. The most recent study is by Picot, et al. [31], the authors investigated the same population as ours (but younger): elite female handball players. They performed a t-test to assess the limb asymmetry and did not find any differences either. Our study is following the literature. It seems that the t-test and correlation are not discriminating against the player at risk of injury.
Another indicator for the discrimination of risk of injury with the mSEBT is the 4 cm difference of distance on the ANT axis between legs [17]. In our study, the injured players showed only a few of their measurements presenting a 4 cm difference between legs: P3# had 1 on 18 tests with a 4 cm difference between legs, P4#: 2 tests over 18, P9#: 4/18, P12#: 4/18. The last injured player, P10#, showed more than 4 cm differences between legs on the ANT axis for 50% of the measurements through the season, she did not report the injury in the season but reported an injury after the summer break. There was no more testing at that time but it is possible that the imbalance measured then was not compensated during the break and the differences could therefore predict this injury. Our injured players reported very few tests over the 4 cm difference but so did the uninjured players (P1:1/16, P5:1/16, P6:1/15, P11:2/18). The literature is controversial on this indicator. On one side there are studies finding that 4 cm asymmetry between legs on the ANT axis is predictive of injury. Smith, et al. [21] investigated college athletes and found greater odds of injury for the participants with an ANT asymmetry greater than 4 cm. Similarly, Stiffler, et al. [43] found the 4 cm difference between legs on the ANT axis to be discriminant for injury in college athletes. On the other side, there are studies with similar results as ours: the authors found that the 4 cm difference between legs on the ANT axis was not linked to injury risk. Those results were found in American football players [30], adolescent and elite soccer players [22,41,42], female active women [26], and handball players [31].
The 4 cm difference seems not to be an indicator for the prediction of injury in our study.
Our results possibly present a new indicator discriminating for risk of injury during a follow-up of handball players. All the injured players showed a drop in the composite scores the week before the injury occurs. The study counted five injured players during the 25 weeks of data collection and all of them presented a drop of CS on the injured leg before the occurrence of the injury. Two of the players presented a rather small drop: P3# and P10#. The P3# showed a 2.38% drop on the left CS before the left ankle sprain, but the injury was not severe and the player did not even stop training or games. The second player is P10#, she did not get injured during the follow-up but reported severe pain in the left foot and presented a 1.42% drop of left CS the week before the pain started. The player eventually reported injury at the end of the season with a left plantar fascia injury. The P9# showed a drop of 2.45% of the right CS and reported a right calf muscle twitch. The P12# suffered two injuries and presented drops in the scores before each injury. A drop of 3.18% of the right CS was measured before a right ankle sprain and a drop of 2.25% of the right CS was measured before a right hamstring injury. The most important drop was a measure for P4# with a 5.5% decrease on the right CS before a major injury: right ACL.
In our study, each injury is preceded by a drop in composite score on the injured leg. The repeated measurements of mSEBT seem to predict the immediate occurrence of injury. This is assuming that the decrease in performance in mSEBT is only due to fatigue or balance impairment. However, a repeated measure of mSEBT weekly across the season requests a high commitment from the players to perform the tests at the maximum of their ability. A low motivation to perform the test could be a factor for lower mSEBT scores. To control this aspect, self-perception questionnaires were filled-up every day by the players and included motivation, well-being, sleep duration and quality, self-reported training intensity and muscular pain intensity. Unfortunately, the results were incomplete: all the players did not thoroughly filled-up the questionnaires, therefore, the results could not be used. Further work is needed to investigate and validate the drop of CS as a potential indicator of injury including other variables such as motivation. The drop in CS corresponds to a negative variation of CS through time. The graph of the distribution of the frequency of occurrence of the variation of the CS showed that 7.38% of the CS are drops included in a range between -12 and -2 points. The injured players (except P3#) presented drops of CS of at least 2 points before the injuries and therefore are included in the 7.38% occurrence of extreme negative values (range [-12: -2]). The P3# did not show drops of -2 but as explained earlier, she only experiences minor injuries with no stop of training and games, it could even be argued that her sprains should not be counted as proper injuries but rather instability. The drops of at least 2 points of CS from one test to the next one could be predictive of injury. This observation arises from an exploratory analysis. Therefore, it needs further investigations and a larger number of participants to define a threshold for the drop delimitating the range of values predictive of injury but also to determine the incidence of injury for the players with CS included in that “risk range”.
In our study, three players reported injuries in the same week (week 12). It suggested that the injuries were due to the same factor at the same time. The only common factor for the players is the training load. We suppose that the training load was high for the player in the weeks before week 12. This was confirmed by the self-evaluation of training intensity but the results of the questionnaire were not complete to be fully used in this study. We can only suggest recording the training load along with the mSEBT for future study.
Five injured players among the eleven participants seem not enough to determine a threshold of the drop as an alert for the risk of injury. Therefore, it would be interesting to include more players in the follow-up and continue the measurements of the already included participants to verify if the drop indicating risk of injury is consistent in long-term follow-up.
The objective of the study was to use the mSEBT as a follow-up measurement to detect precisely the period of the risk of injury for female handball players. The usual indicators of the literature, which are the composite score cut-off and the 4 cm difference of distance between legs on the anteroposterior axis, were not conclusive in our study to detect injury. However, we proposed a new indicator, which was 100% valid for our players in detecting injuries. The new indicator is a sudden drop in the composite score over time. Further work is needed to validate the indicator in a larger population and in other sports and to set a threshold alerting for the risk of injury. To our knowledge, this is the first study proposing to follow-up measurement of mSEBT to predict injury. This is consequently also the first study to propose a new indicator for the prevention of injury during a follow-up mSEBT.
The authors would like to thank the staff and the players of the Saint-Amand Handball club for their participation in the study. The authors would like to thank Marion Sauvage from UPHF for her work at the beginning of the project and Paul Renaud-Goud for the help in designing the analysis programmes. Finally, the authors would like to thank Dr. Christophe Gillet for the time he devoted to the discussion about statistics and Dr. Sebastien Leteneur for his guidance during the master 3MH.
- Karcher C, Buchheit M. On-court demands of elite handball, with special reference to playing positions. Sports Med. 2014 Jun;44(6):797-814. doi: 10.1007/s40279-014-0164-z. PMID: 24682948.
- Åman M, Forssblad M, Henriksson-Larsén K. Incidence and severity of reported acute sports injuries in 35 sports using insurance registry data. Scand J Med Sci Sports. 2016 Apr;26(4):451-62. doi: 10.1111/sms.12462. Epub 2015 Apr 8. PMID: 25850826.
- Luig P, Krutsch W, Nerlich M, Henke T, Klein C, Bloch H. Increased injury rates after the restructuring of Germany’s national second league of team handball. Knee Surgery, Sport Traumatol Arthrosc . 2018;26(7):1884-91. http://dx.doi.org/10.1007/s00167-018-4851-4
- Myklebust G, Maehlum S, Engebretsen L, Strand T, Solheim E. Registration of cruciate ligament injuries in Norwegian top level team handball. A prospective study covering two seasons. Scand J Med Sci Sports. 1997 Oct;7(5):289-92. doi: 10.1111/j.1600-0838.1997.tb00155.x. PMID: 9338947.
- Myklebust G, Maehlum S, Engebretsen L, Strand T, Solheim E. Registration of cruciate ligament injuries in Norwegian top level team handball. A prospective study covering two seasons. Scand J Med Sci Sports. 1997 Oct;7(5):289-92. doi: 10.1111/j.1600-0838.1997.tb00155.x. PMID: 9338947.
- Langevoort G, Myklebust G, Dvorak J, Junge A. Handball injuries during major international tournaments. Scand J Med Sci Sports. 2007 Aug;17(4):400-7. doi: 10.1111/j.1600-0838.2006.00587.x. Epub 2006 Oct 12. PMID: 17038157.
- Laver L, Luig P, Achenbach L, Myklebust G, Karlsson J. Handball Injuries: Epidemiology and Injury Characterization: Part 1. Handball Sport Med. 2018;141-53.
- Holdhaus H. Injury Study Ehf Women’s Euro 2010 in Denmark & Norway. EHF web Periodical. 2010;5. http://www.eurohandball.com/publications
- van Mechelen W, Hlobil H, Kemper HC. Incidence, severity, aetiology and prevention of sports injuries. A review of concepts. Sports Med. 1992 Aug;14(2):82-99. doi: 10.2165/00007256-199214020-00002. PMID: 1509229.
- Dauty M, Louvet S, Potiron-Josse M, Dubois C. Désentraînement et réentraînement du cycliste de haut niveau immobilisé par blessure [Detraining and retraining after injury in a high-level cyclist]. Ann Readapt Med Phys. 2005 Mar;48(2):93-100. French. doi: 10.1016/j.annrmp.2004.09.006. Epub 2005 Jan 12. PMID: 15748774.
- Vigelsø A, Gram M, Wiuff C, Andersen JL, Helge JW, Dela F. Six weeks' aerobic retraining after two weeks' immobilization restores leg lean mass and aerobic capacity but does not fully rehabilitate leg strength in young and older men. J Rehabil Med. 2015 Jun;47(6):552-60. doi: 10.2340/16501977-1961. PMID: 25898161.
- Bahr R, Krosshaug T. Understanding injury mechanisms: a key component of preventing injuries in sport. Br J Sports Med. 2005 Jun;39(6):324-9. doi: 10.1136/bjsm.2005.018341. PMID: 15911600; PMCID: PMC1725226.
- Steffen K, Andersen TE, Krosshaug T, van Mechelen W, Myklebust G, Verhagen EA. Ecss position statement 2009: Prevention of acute sports injuries. Eur J Sport Sci. 2010;10(4):223–36.
- Collings TJ, Bourne MN, Barrett RS, du Moulin W, Hickey JT, Diamond LE. Risk Factors for Lower Limb Injury in Female Team Field and Court Sports: A Systematic Review, Meta-analysis, and Best Evidence Synthesis. Sports Med. 2021;51(4):759–76. https://doi.org/10.1007/s40279-020-01410-9
- Buffet M, Morel N, Navacchia M, Voyez J, Vella-Boucaud J, Edouard P. Blessures chez des joueuses de basketball féminin de haut niveau durant une saison. Sci Sport . 2015;30(3):134–46. http://dx.doi.org/10.1016/j.scispo.2015.02.008
- Von Rosen P, Kottorp A, Fridén C, Frohm A, Heijne A. Young, talented and injured: Injury perceptions, experiences, and consequences in adolescent elite athletes. Eur J Sport Sci . 2018;18(5):731–40. https://doi.org/10.1080/17461391.2018.1440009
- Plisky PJ, Rauh MJ, Kaminski TW, Underwood FB. Star Excursion Balance Test as a predictor of lower extremity injury in high school basketball players. J Orthop Sports Phys Ther. 2006 Dec;36(12):911-9. doi: 10.2519/jospt.2006.2244. PMID: 17193868.
- Gribble PA, Hertel J, Plisky P. Using the Star Excursion Balance Test to assess dynamic postural-control deficits and outcomes in lower extremity injury: a literature and systematic review. J Athl Train. 2012 May-Jun;47(3):339-57. doi: 10.4085/1062-6050-47.3.08. PMID: 22892416; PMCID: PMC3392165.
- Picot B, Terrier R, Forestier N, Fourchet F, McKeon PO. The Star Excursion Balance Test: An Update Review and Practical Guidelines. Int J Athl Ther Train. 2021;26(6):285–93.
- Olmsted LC, Carcia CR, Hertel J, Shultz SJ. Efficacy of the Star Excursion Balance Tests in Detecting Reach Deficits in Subjects With Chronic Ankle Instability. J Athl Train. 2002 Dec;37(4):501-506. PMID: 12937574; PMCID: PMC164384.
- Smith CA, Chimera NJ, Warren M. Association of y balance test reach asymmetry and injury in division I athletes. Med Sci Sports Exerc. 2015 Jan;47(1):136-41. doi: 10.1249/MSS.0000000000000380. PMID: 24870573.
- Gonell AC, Romero JA, Soler LM. Relationship between the y balance test scores and soft tissue injury incidence in a soccer team. Int J Sports Phys Ther. 2015 Dec;10(7):955-66. PMID: 26673848; PMCID: PMC4675196.
- Udompanich N, Thanasootr KO, Chanavirut R, Chatchawan U, Hunsawong T. The Cut-Off Score of Four Clinical Tests to Quantify Balance Impairment in Individuals with Chronic Ankle Instability. Malays J Med Sci. 2021 Aug;28(4):87-96. doi: 10.21315/mjms2021.28.4.9. Epub 2021 Aug 26. PMID: 34512133; PMCID: PMC8407791.
- Robinson RH, Gribble PA. Support for a reduction in the number of trials needed for the star excursion balance test. Arch Phys Med Rehabil. 2008 Feb;89(2):364-70. doi: 10.1016/j.apmr.2007.08.139. PMID: 18226664.
- van Lieshout R, Reijneveld EA, van den Berg SM, Haerkens GM, Koenders NH, de Leeuw AJ, van Oorsouw RG, Paap D, Scheffer E, Weterings S, Stukstette MJ. Reproducibility of the modified star excursion balance test composite and specific reach direction scores. Int J Sports Phys Ther. 2016 Jun;11(3):356-65. PMID: 27274422; PMCID: PMC4886804.
- Bulow A, Anderson JE, Leiter JR, MacDonald PB, Peeler J. The modified star excursion balance and y-balance test results differ when assessing physically active healthy adolescent females. Int J Sports Phys Ther. 2019 Apr;14(2):192-203. PMID: 30997272; PMCID: PMC6449011.
- Gribble PA, Tucker WS, White PA. Time-of-day influences on static and dynamic postural control. J Athl Train. 2007 Jan-Mar;42(1):35-41. PMID: 17597941; PMCID: PMC1896064.
- Picot B, Terrier R, Forestier N. Le Star Excursion Balance Test : Mise à jour et recommandation sur son utilisation en pratique The Star Excursion Balnce Test: up-date, recommendations and pratical guidelines. Mains Libr. 2018; 4 :9–16.
- Hertel J, Braham RA, Hale SA, Olmsted-Kramer LC. Simplifying the star excursion balance test: analyses of subjects with and without chronic ankle instability. J Orthop Sports Phys Ther. 2006 Mar;36(3):131-7. doi: 10.2519/jospt.2006.36.3.131. PMID: 16596889.
- Butler RJ, Lehr ME, Fink ML, Kiesel KB, Plisky PJ. Dynamic balance performance and noncontact lower extremity injury in college football players: an initial study. Sports Health. 2013 Sep;5(5):417-22. doi: 10.1177/1941738113498703. PMID: 24427412; PMCID: PMC3752196.
- Picot B, Dury J, Néron G, McKeon PO, Forestier N. Establishing Normative Dynamic Postural Control Values in Elite Female Handball Players. Int J Sports Phys Ther. 2022 Oct 1;17(6):1083-1094. doi: 10.26603/001c.38174. PMID: 36237642; PMCID: PMC9528723.
- Hoch MC, Staton GS, Medina McKeon JM, Mattacola CG, McKeon PO. Dorsiflexion and dynamic postural control deficits are present in those with chronic ankle instability. J Sci Med Sport . 2012;15(6):574–9. http://dx.doi.org/10.1016/j.jsams.2012.02.009
- Fullam K, Caulfield B, Coughlan GF, Delahunt E. Kinematic analysis of selected reach directions of the Star Excursion Balance Test compared with the Y-Balance Test. J Sport Rehabil. 2014 Feb;23(1):27-35. doi: 10.1123/jsr.2012-0114. Epub 2013 Aug 12. PMID: 23945793.
- Kaminski TW, Gribble P. The Star Excursion Balance Test as a Measurement Tool. Athl Ther Today. 2016;8(2):46–7.
- Seil R, Rupp S, Tempelhof S, Kohn D. Sports injuries in team handball. A one-year prospective study of sixteen men's senior teams of a superior nonprofessional level. Am J Sports Med. 1998 Sep-Oct;26(5):681-7. doi: 10.1177/03635465980260051401. PMID: 9784816.
- Hertel J, Miller SJ, Denegar CR. Intratester and intertester reliability during the star excursion balance tests. J Sport Rehabil. 2000;9(2):104–16.
- Lim JS, Kim S, Moon I, Yi C. The Effects of Elastic Ankle Taping on Static and Dynamic Postural Control in Individuals With Chronic Ankle Instability. Phys Ther Korea. 2021;28(3):200–7.
- Horsak B, Simonlehner M, Dumphart B, Kainz H, Killen B, Jonkers I. Patella-femoral joint loading during the modified Star Excursion Balance Test: Preliminary results of an extensive simulation study. Gait Posture. 2022 ;97:S5–6.
- Coughlan GF, Fullam K, Delahunt E, Gissane C, Caulfield BM. A comparison between performance on selected directions of the star excursion balance test and the Y balance test. J Athl Train. 2012 Jul-Aug;47(4):366-71. doi: 10.4085/1062-6050-47.4.03. PMID: 22889651; PMCID: PMC3396295.
- Lee DK, Kim GM, Ha SM, Oh JS. Correlation of the Y-Balance Test with Lower-limb Strength of Adult Women. J Phys Ther Sci. 2014 May;26(5):641-3. doi: 10.1589/jpts.26.641. Epub 2014 May 29. PMID: 24926122; PMCID: PMC4047222.
- Onofrei RR, Amaricai E, Petroman R, Surducan D, Suciu O. Preseason Dynamic Balance Performance in Healthy Elite Male Soccer Players. Am J Mens Health. 2019 Jan-Feb;13(1):1557988319831920. doi: 10.1177/1557988319831920. PMID: 30776956; PMCID: PMC6775551.
- Philp F, Telford C, Reid D, Mccluskey M. Establishing normative performance values of modified Star Excursion Balance Test (mSEBT) and Limb 4 Symmetry Index (LSI) scores and their relationship to age in female adolescent footballers. 2019.
- Stiffler MR, Bell DR, Sanfilippo JL, Hetzel SJ, Pickett KA, Heiderscheit BC. Star Excursion Balance Test Anterior Asymmetry is Associated with Injury Status in Division I Collegiate Athletes. J Orthop Sports Phys Ther . 2017;47(5):339–45.